Every ATM is a P&L decision.
Make it with evidence.

Where to deploy, which to close, where to compete — each answer is worth hundreds of thousands a year, per machine. AMI's flagship product runs the whole estate through one engine: a four-level P&L for every ATM, the entire market on one map, the cash inside the machines, and the forensics when they misbehave.

37
ATM dashboards, live
4
P&L levels, per machine
1
Map: your estate and theirs

Know what every machine earns

Transaction analytics and a four-level P&L for every ATM in the estate — so the question "is this machine worth keeping?" has an answer, not an opinion, and a site in decline surfaces long before the annual review.
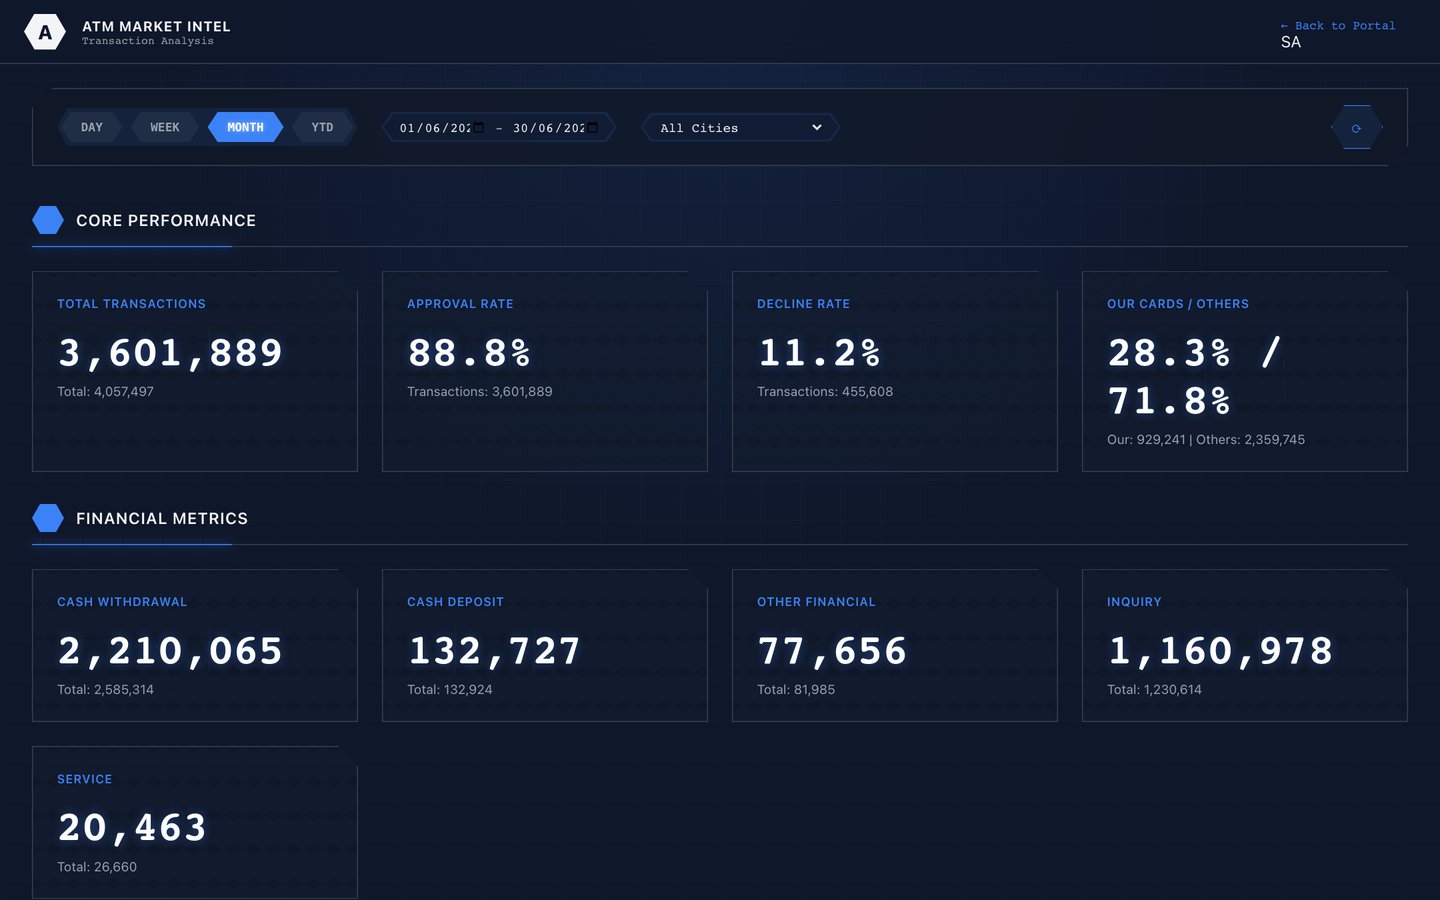
ATM KPI dashboard showing total transactions, approval rate, decline rate and cash withdrawal volumes

Network performance at a glance

Millions of transactions, approval and decline rates, and your-cards-versus-others split — current, every day.
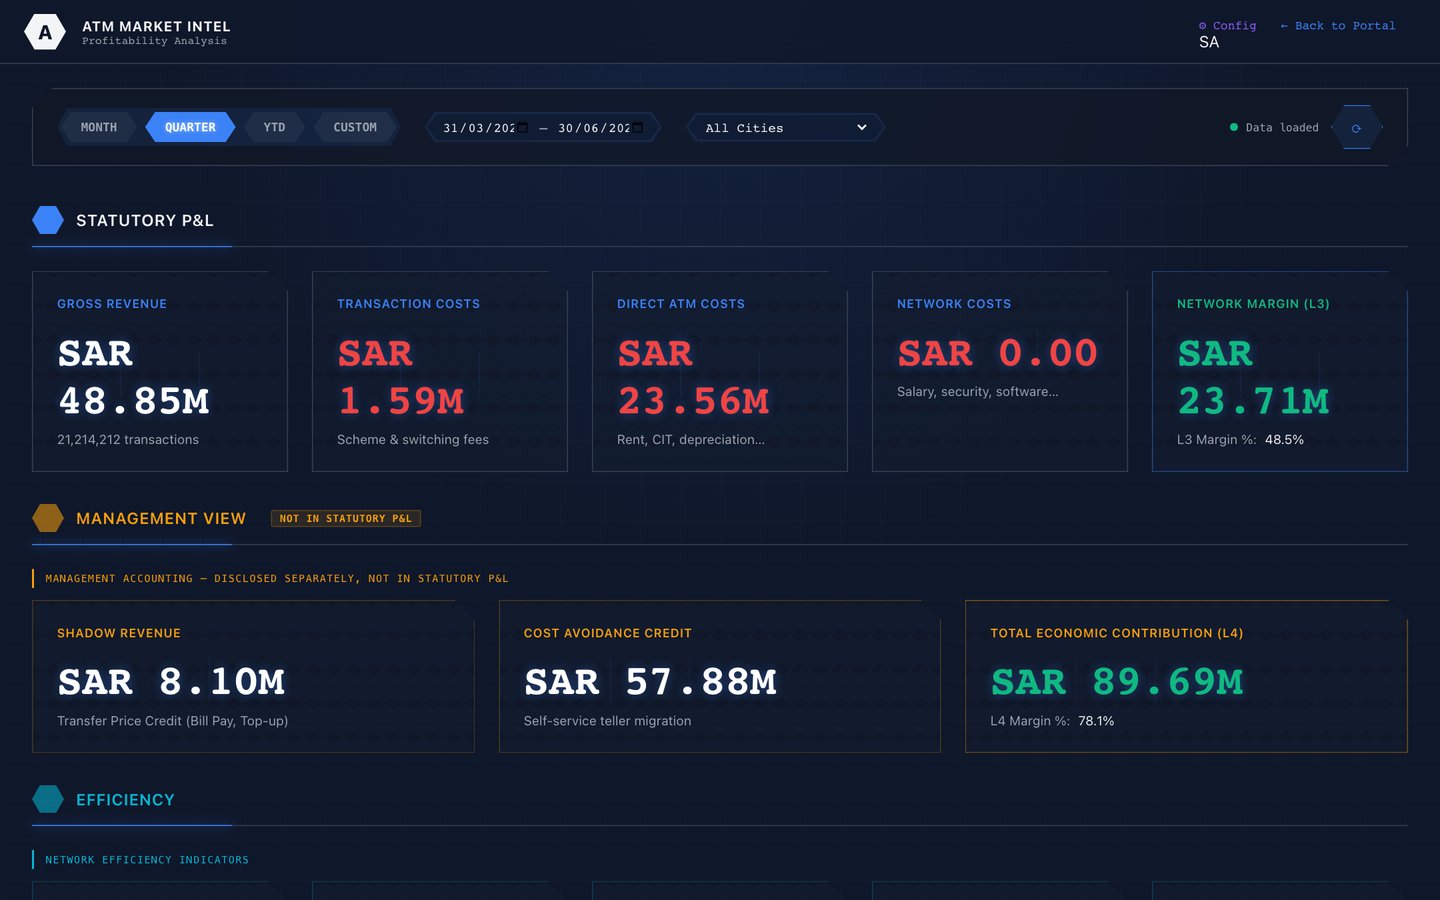
Per-ATM profitability dashboard showing revenue and cost breakdown across the estate

Four-level P&L, per machine

Revenue, direct cost, allocated cost and contribution — the machines that earn and the ones that bleed, ranked.
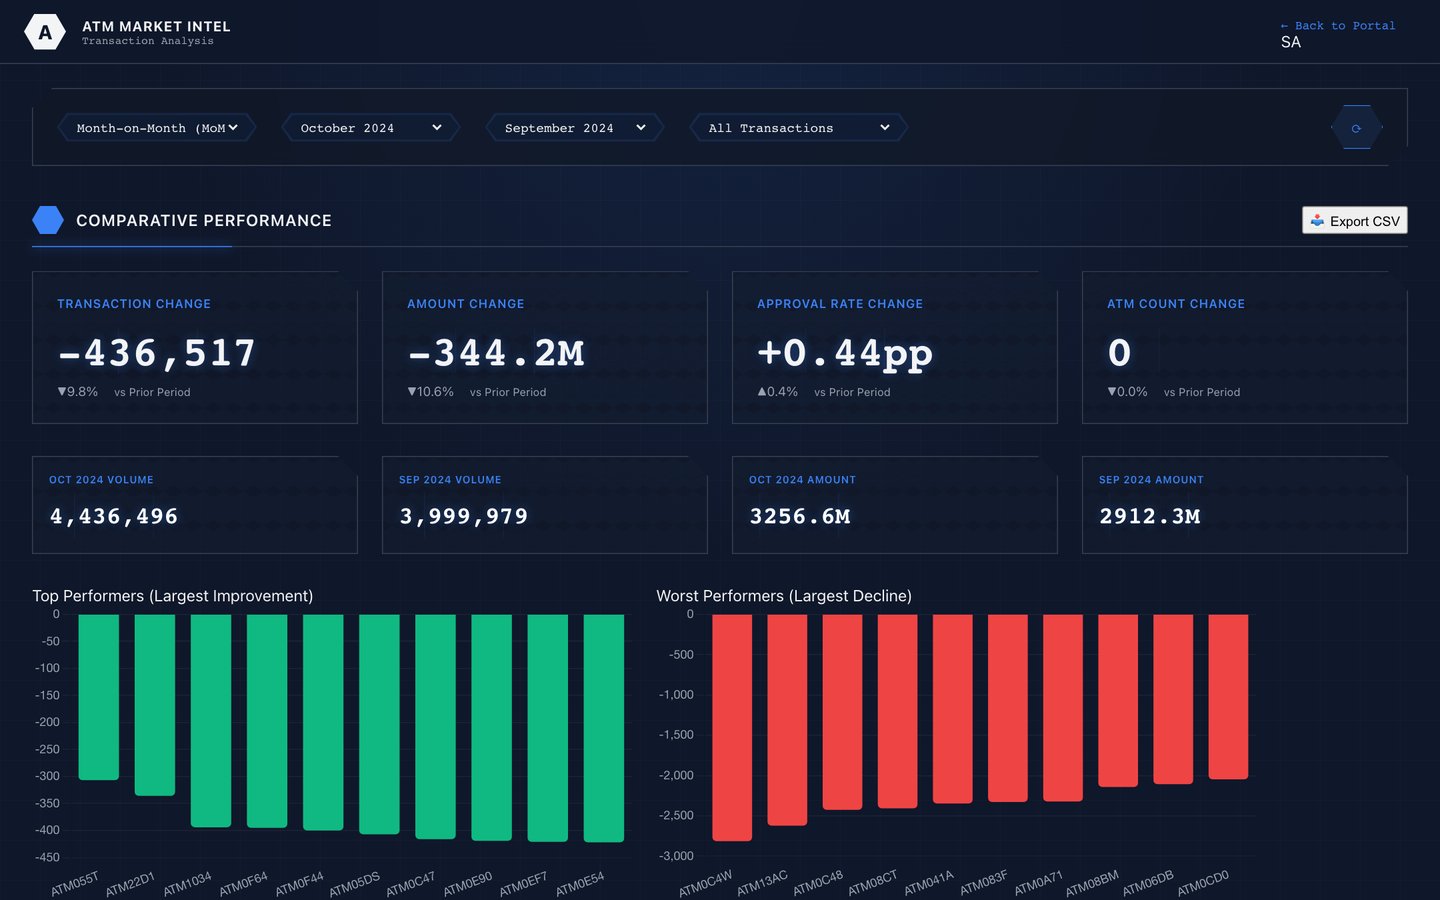
Month on month transaction shift analysis with per-ATM gain and loss bars

Catch demand moving early

Month-on-month shifts per ATM — a machine losing volume gets flagged while relocation is still cheap.
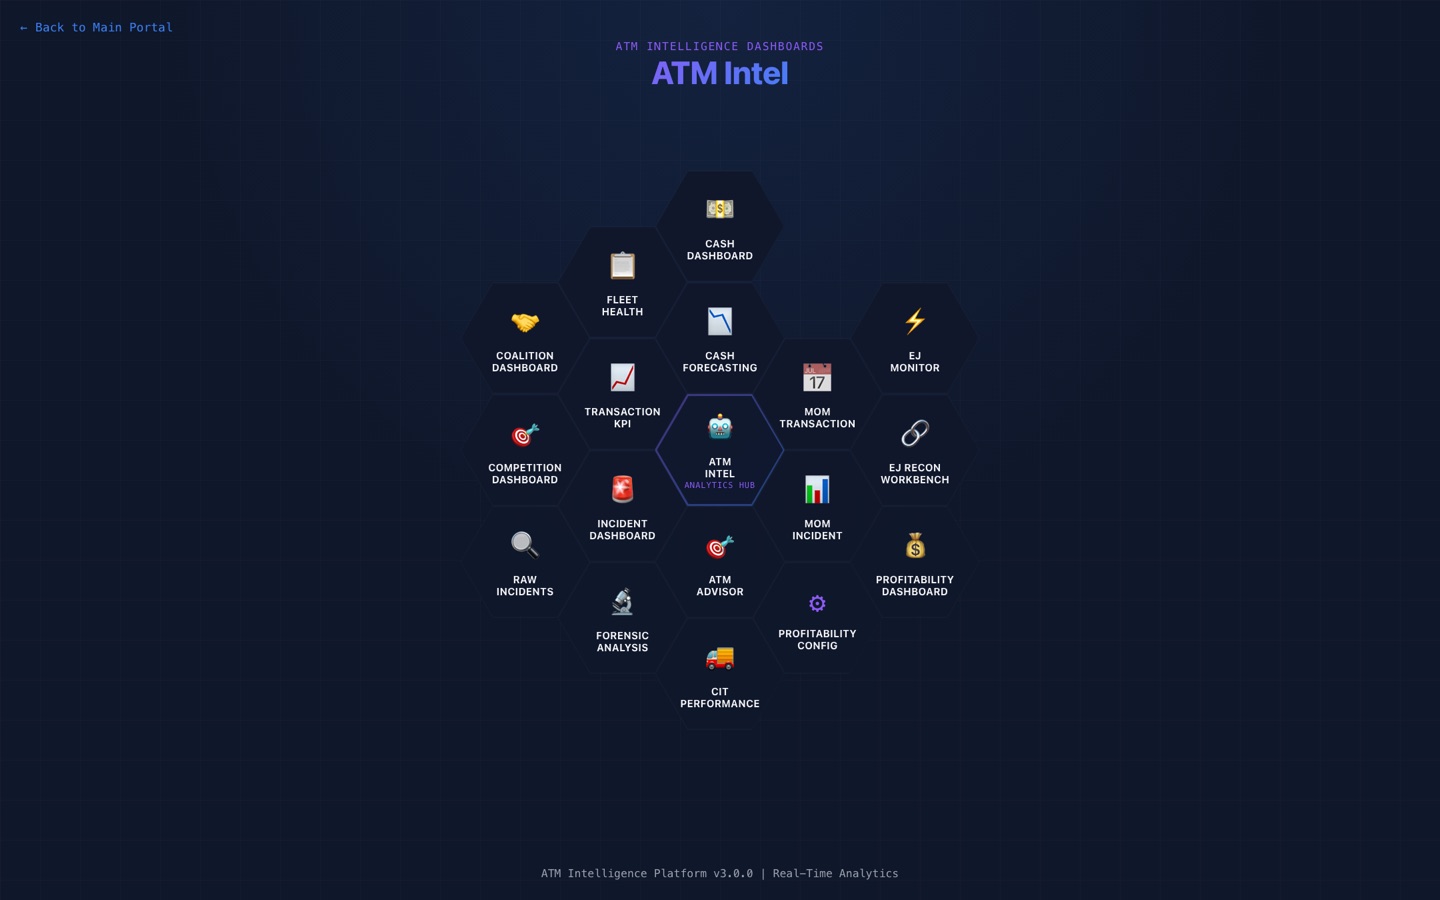
ATM intelligence hub landing page linking all ATM dashboards

One front door

Every ATM view — P&L, cash, incidents, forensics, advisor — reached from a single hub.
Where to deploy. Where to compete.

Spatial analysis over the whole market — hexagonal demand indexing, multi-criteria site scoring calibrated to your network, and the competitor machines your own cardholders are already walking to.

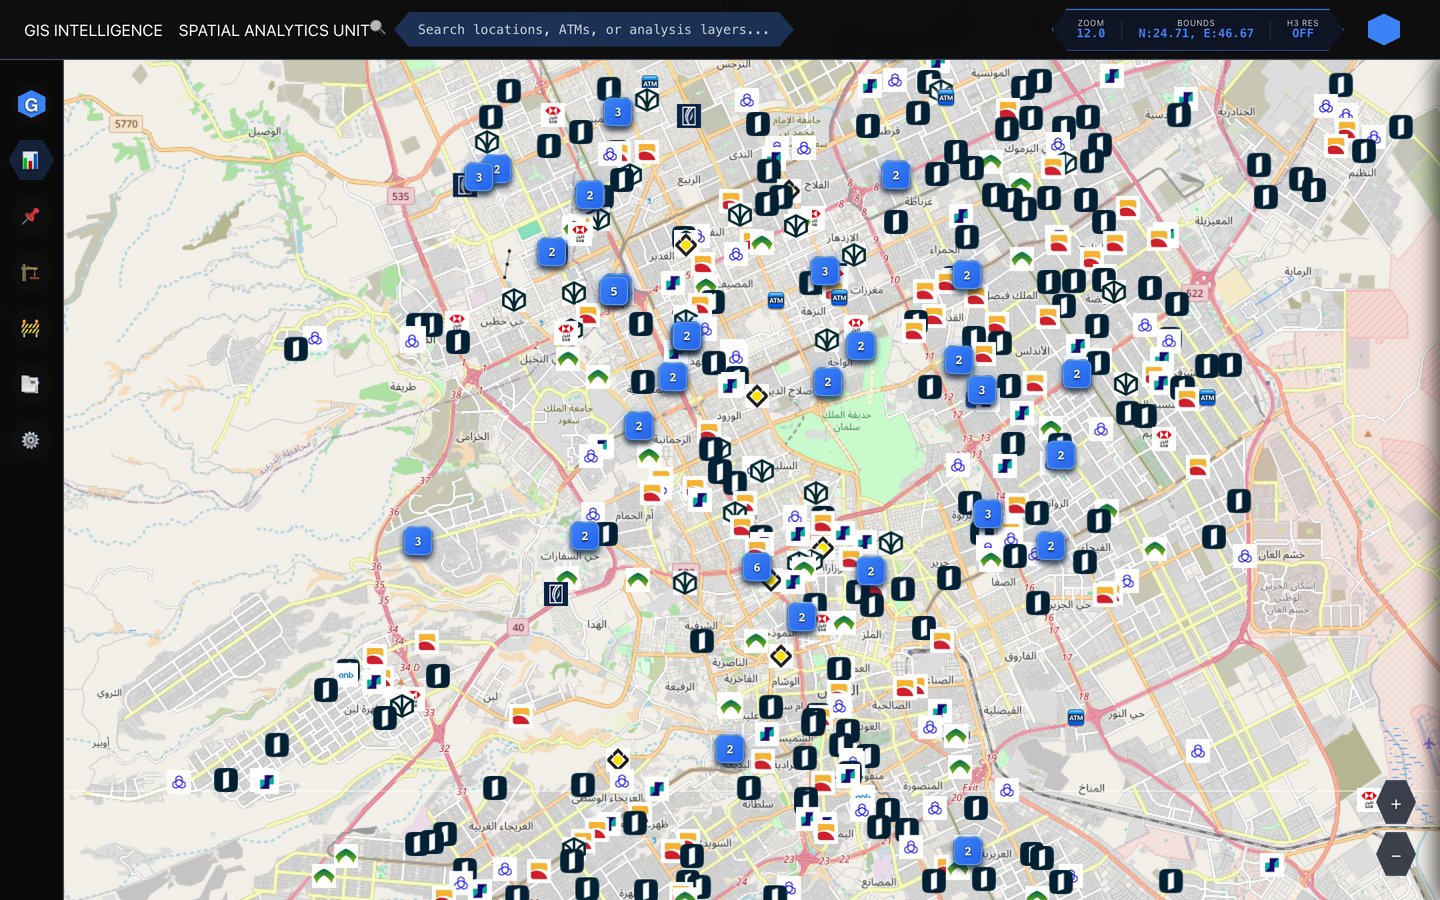
Interactive GIS map showing ATMs and competitor locations across the city with clustering

The whole market, one map

Your estate and every competitor ATM live — see where your cardholders withdraw from someone else's machine.

ATM competition analysis dashboard showing competitor pressure per site

Interchange, recaptured

Where you pay interchange for your own cardholders' withdrawals — and where placing a machine wins it back.

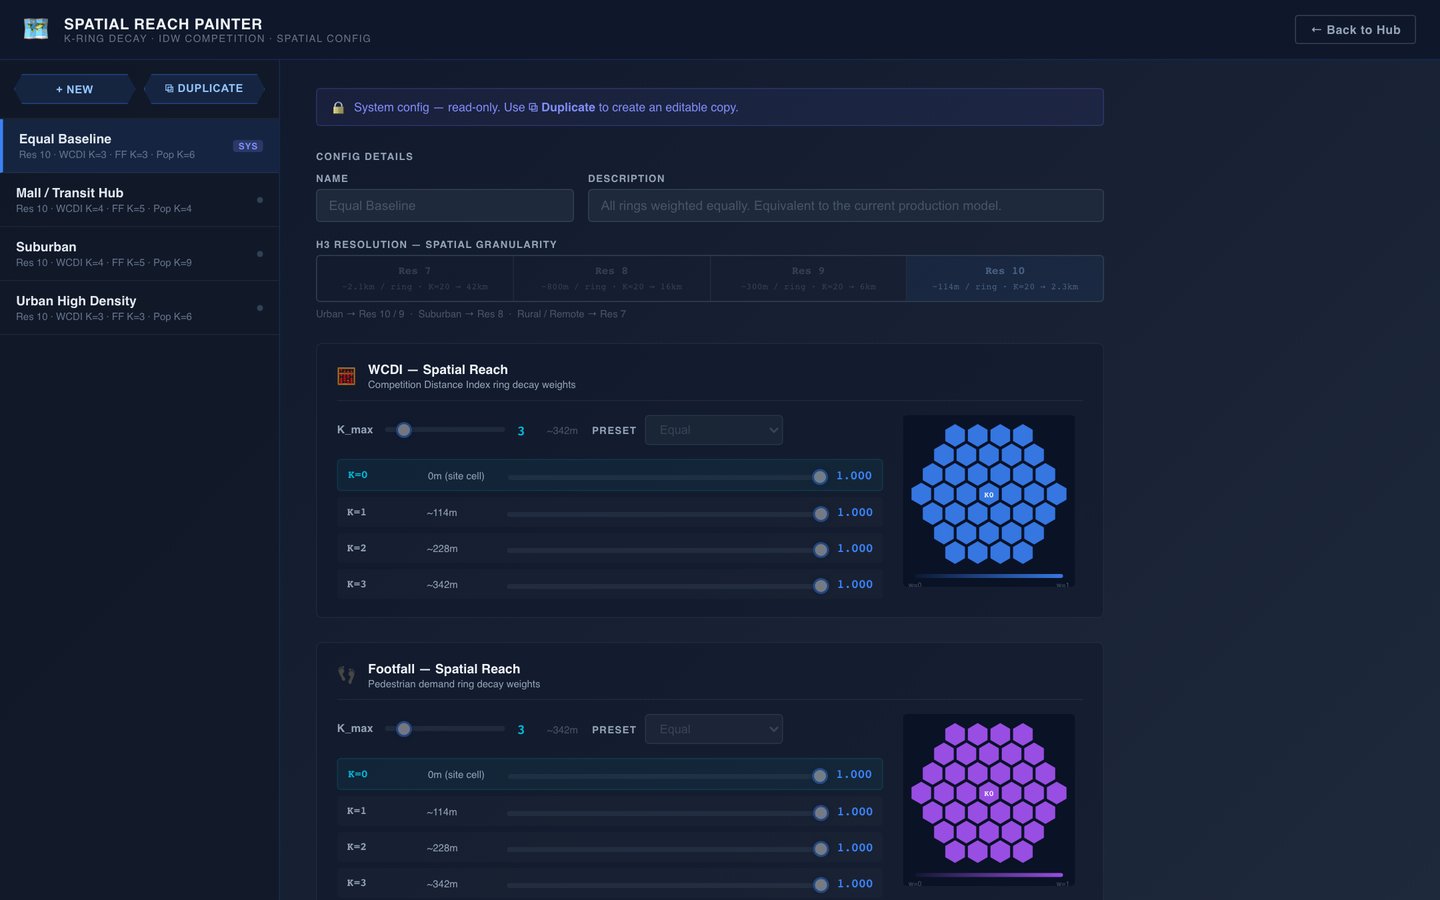
Hexagonal H3 spatial indexing configuration with demand cells

Geography, made comparable

Hexagonal indexing turns messy geography into demand cells you can score, rank and compare like-for-like.

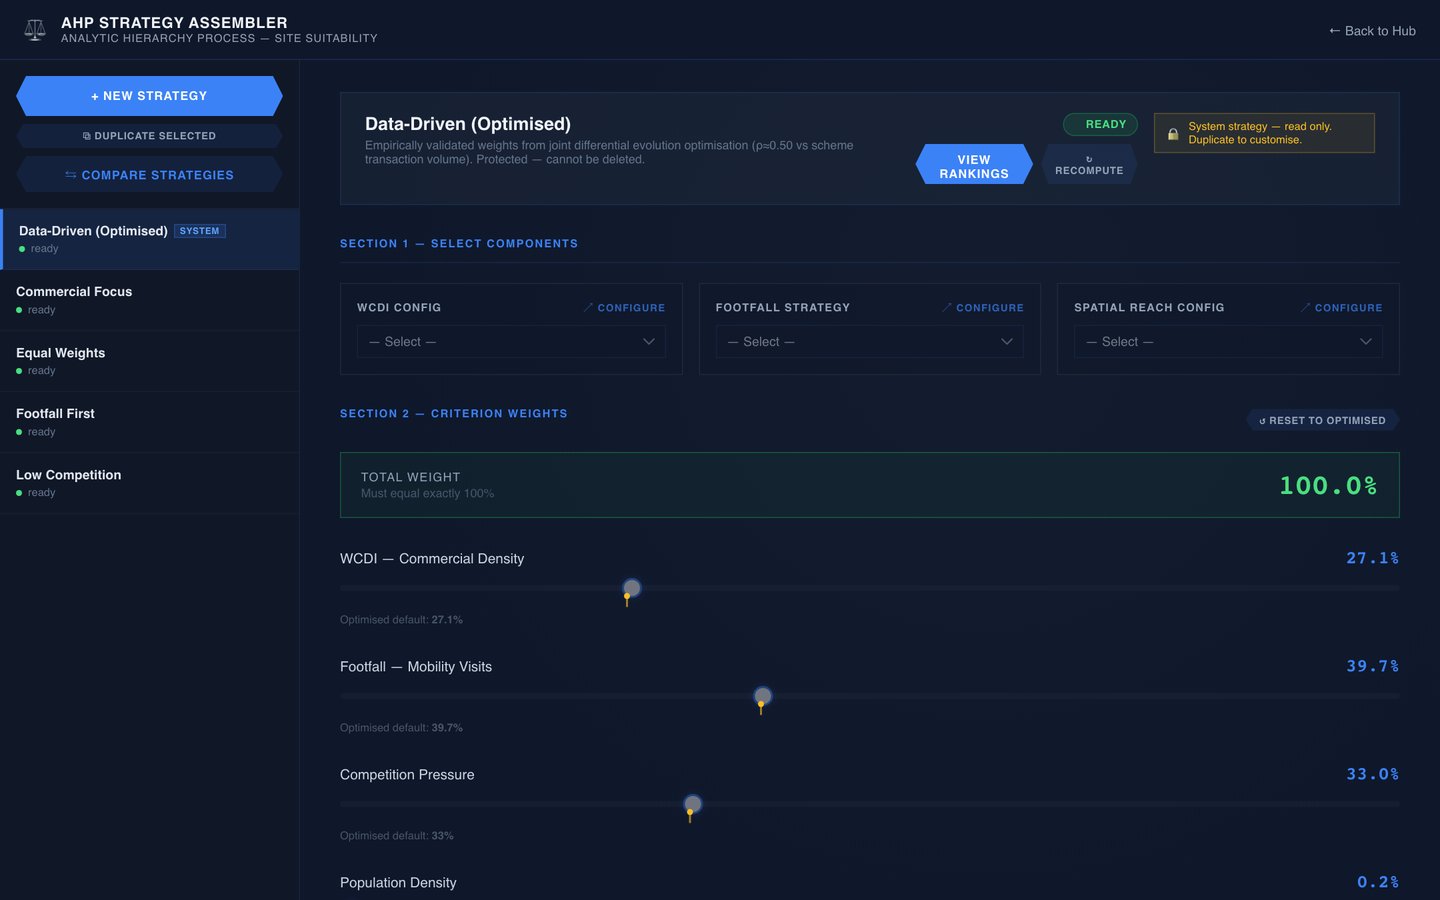
Multi-criteria AHP site scoring weights configuration

Scoring you can defend

Multi-criteria weighting tuned to your market — so a site score reflects your network, not a vendor's default.

Forecast the cash before it runs out

An ATM without cash is a billboard for the bank next door. Demand forecasting and utilisation per machine mean replenishment is planned against predicted need — not against last month's habit. (The branch-and-vault side lives in Cash Intelligence.)

ATM cash demand forecast dashboard

Demand, predicted per machine

Forecast withdrawals per ATM with the drivers behind them — load tomorrow's cassettes on evidence.

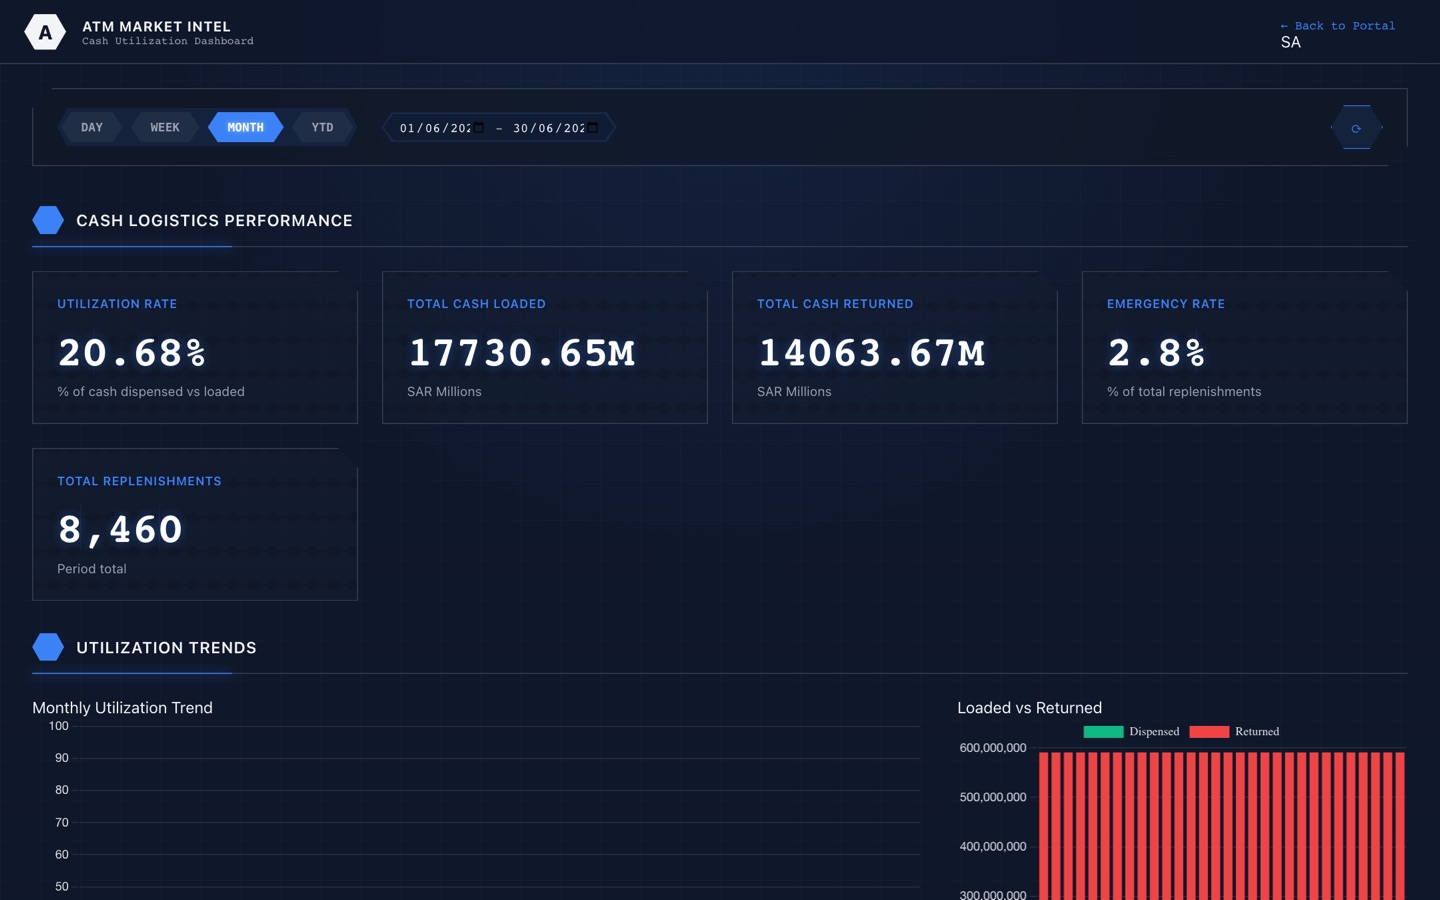
ATM cash utilisation dashboard showing loaded versus dispensed cash

Loaded vs. dispensed

Machines stuffed with idle cash and machines flirting with empty — both cost money, both surface here.

When machines misbehave

Electronic journals record everything the machine actually did. Mining them turns anecdotes into patterns — ghost transactions, component failures and downtime categorised automatically, so your team acts on signals, not surprises.

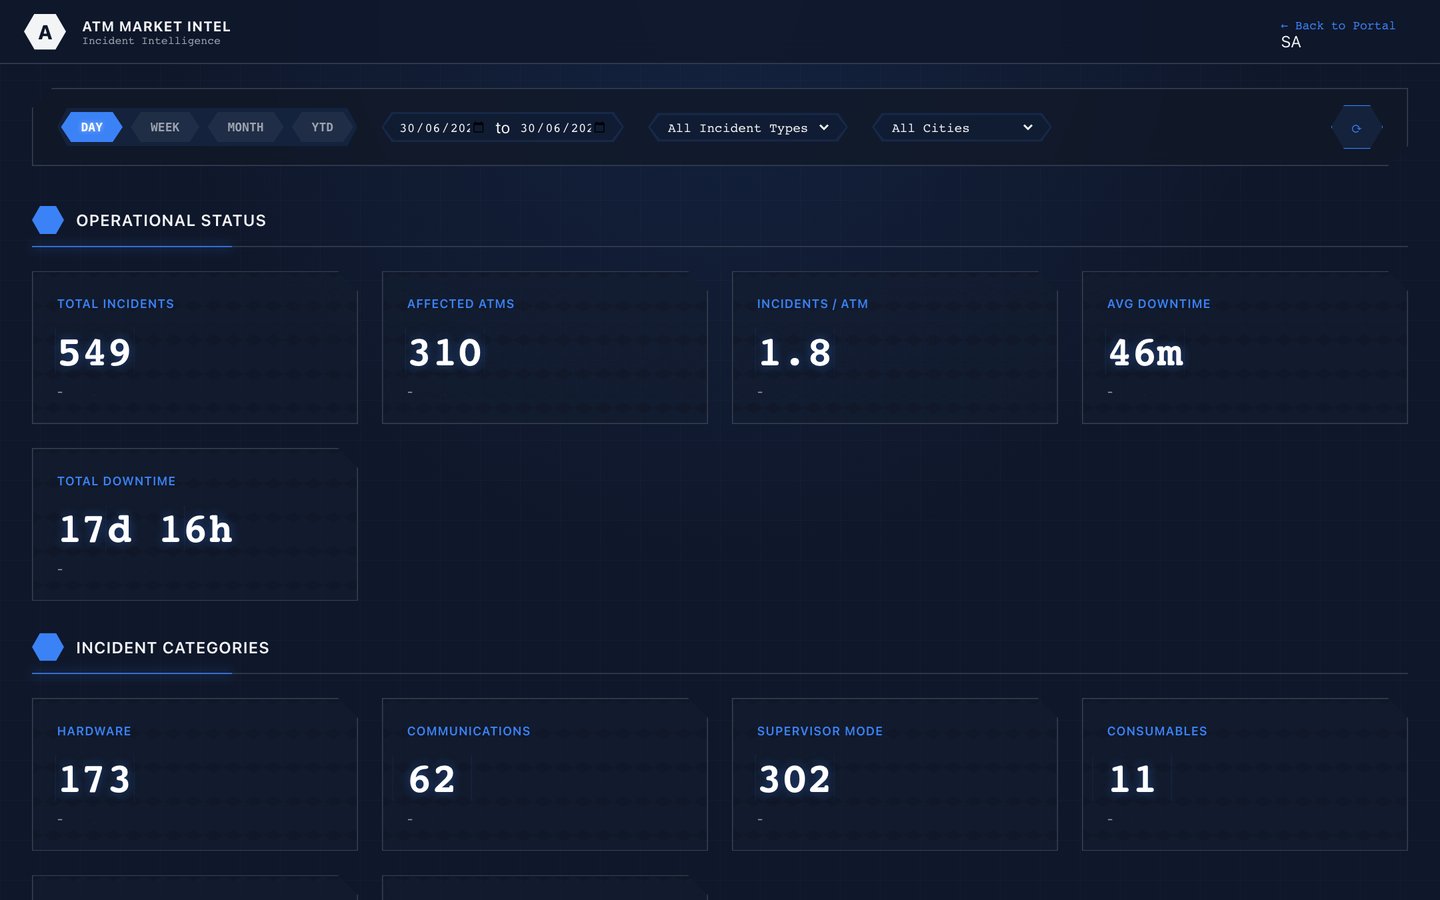
ATM incident dashboard with fault categories and downtime metrics

Faults triaged automatically

Outages, component failures and downtime categorised from the journals — ranked by business impact.

Electronic journal monitor dashboard tracking journal coverage and anomalies

The journals, watched

EJ coverage and anomalies monitored continuously — the hidden failure patterns a fault code never shows.

The whole estate, on the record

Every machine, contract and SLA in one registry — including the competitor estate, so market share is a number rather than a guess and no lease expires by surprise.

Nationwide ATM registry with counts by bank and distribution charts

The national estate, counted

Every ATM in the market, by operator — your share, their share, and where the gaps are.

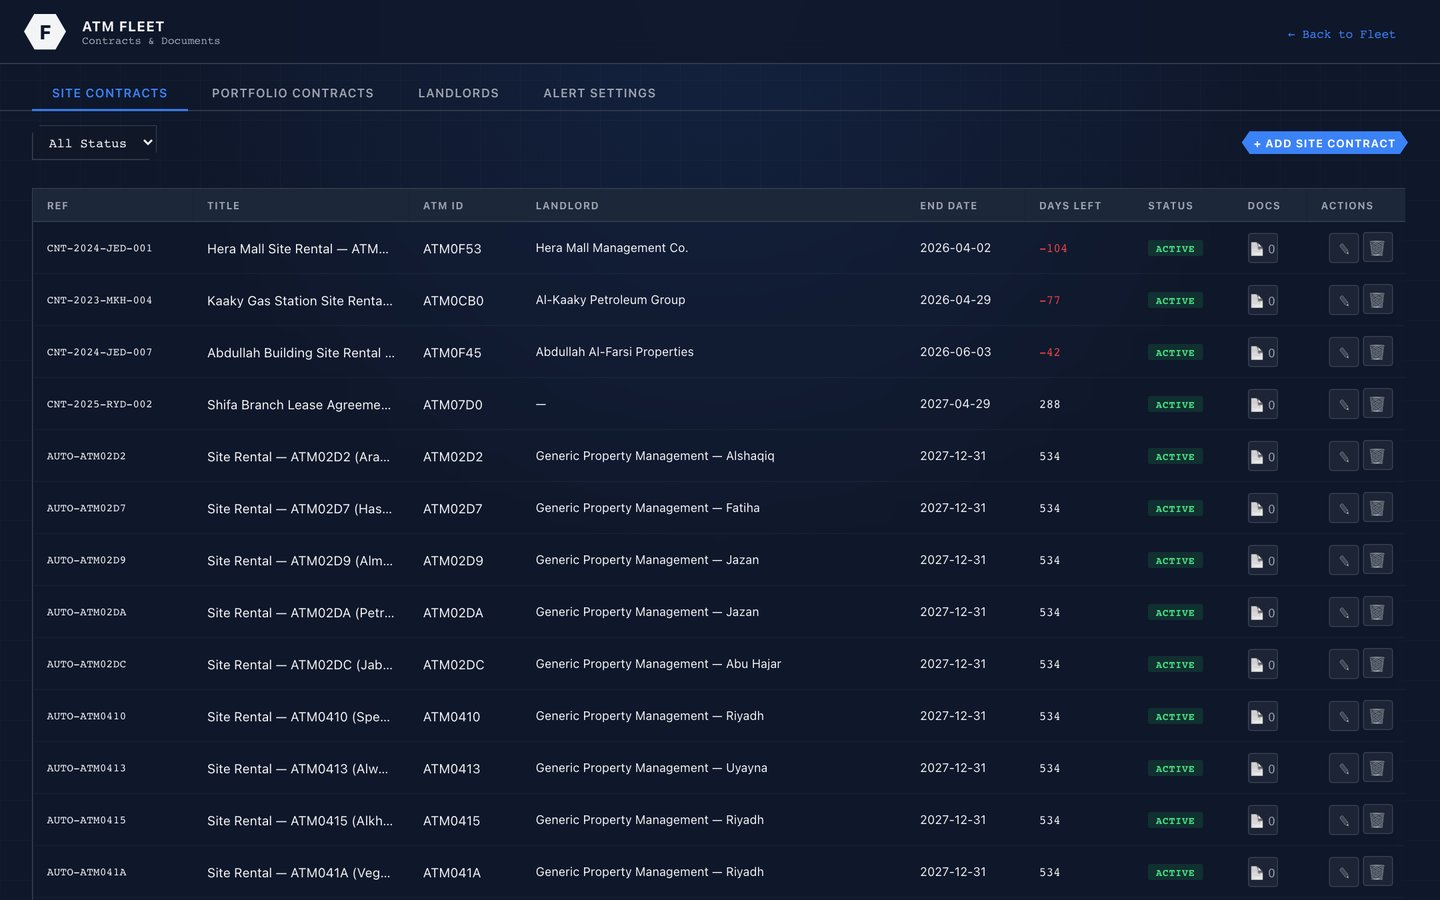
Fleet contracts and SLA tracking with expiry status

No contract expires by surprise

Leases, vendor contracts and SLAs tracked with expiry alerts — renegotiate on your timeline, not theirs.

See it against your own network

These screens run on live bank data — this is the product AMI is proven on. The fastest way to judge the fit is to see the same dashboards built on a sample of yours.

Live Demo Book a Meeting See the Whole Platform