The cost nobody measures.
Branch to vault to regulator.

Cash is one of the largest physical costs a bank carries — idle balances, CIT contracts, insurance, branch effort — and it usually lives in twenty spreadsheets that never agree. AMI puts branches, vaults, CIT and central bank movements on one spine, so the cash position is a number, not a reconciliation project.

15
Cash dashboards, live
4
Layers: branch · vault · CIT · regulator
1
Reconciled cash position

Where the cash is right now

The first question is the one most banks can't answer before lunchtime: how much cash do we hold, where is it, and in what denominations? One command view across branches, vaults and the network — refreshed from the operation, not typed into a template.
Cash command centre dashboard showing network-wide cash position

The whole operation, one screen

Network-wide position, movement and exceptions — the morning view for whoever owns cash.

Cash position and denomination mix dashboard

Down to the denomination

Position by note mix, not just totals — because a vault full of the wrong denominations is still a shortage.

Vault and treasury cash dashboard

The vault, visible

Treasury and vault holdings alongside the branch network — the buffer stock finally on the same page as demand.

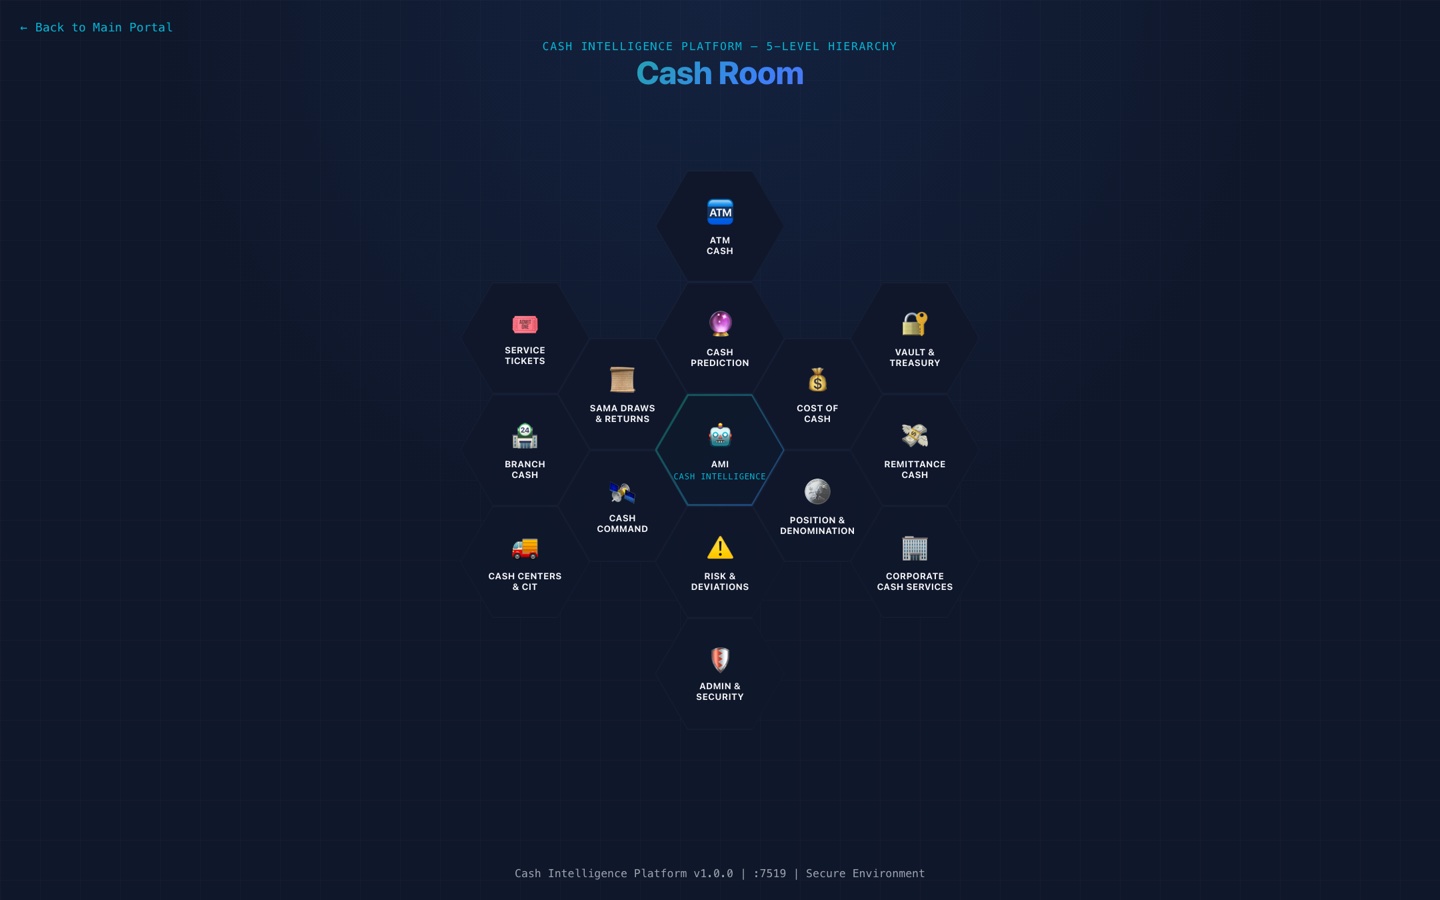
Cash intelligence hub landing page linking all cash dashboards

One front door

Every cash view — branches, vault, CIT, forecast, regulator — reached from a single hub.
Every branch, measured like a fleet

Branches hold cash the way they always have — by habit. Fleet-style health scoring shows which branches sit on too much, which flirt with running dry, and which are drifting from their own baseline before it becomes an incident.

Branch cash fleet dashboard scoring every branch

The fleet view

Every branch scored on holdings, flow and risk — the outliers surface themselves.

Single branch cash detail dashboard with holdings and flow history

One branch, in depth

Holdings, inflow, outflow and history for a single branch — the drill-down behind every fleet-level flag.

Branch fleet health deviation dashboard

Drift, caught early

Branches deviating from their own normal — flagged while it's a trend, not yet a shortage or an audit finding.

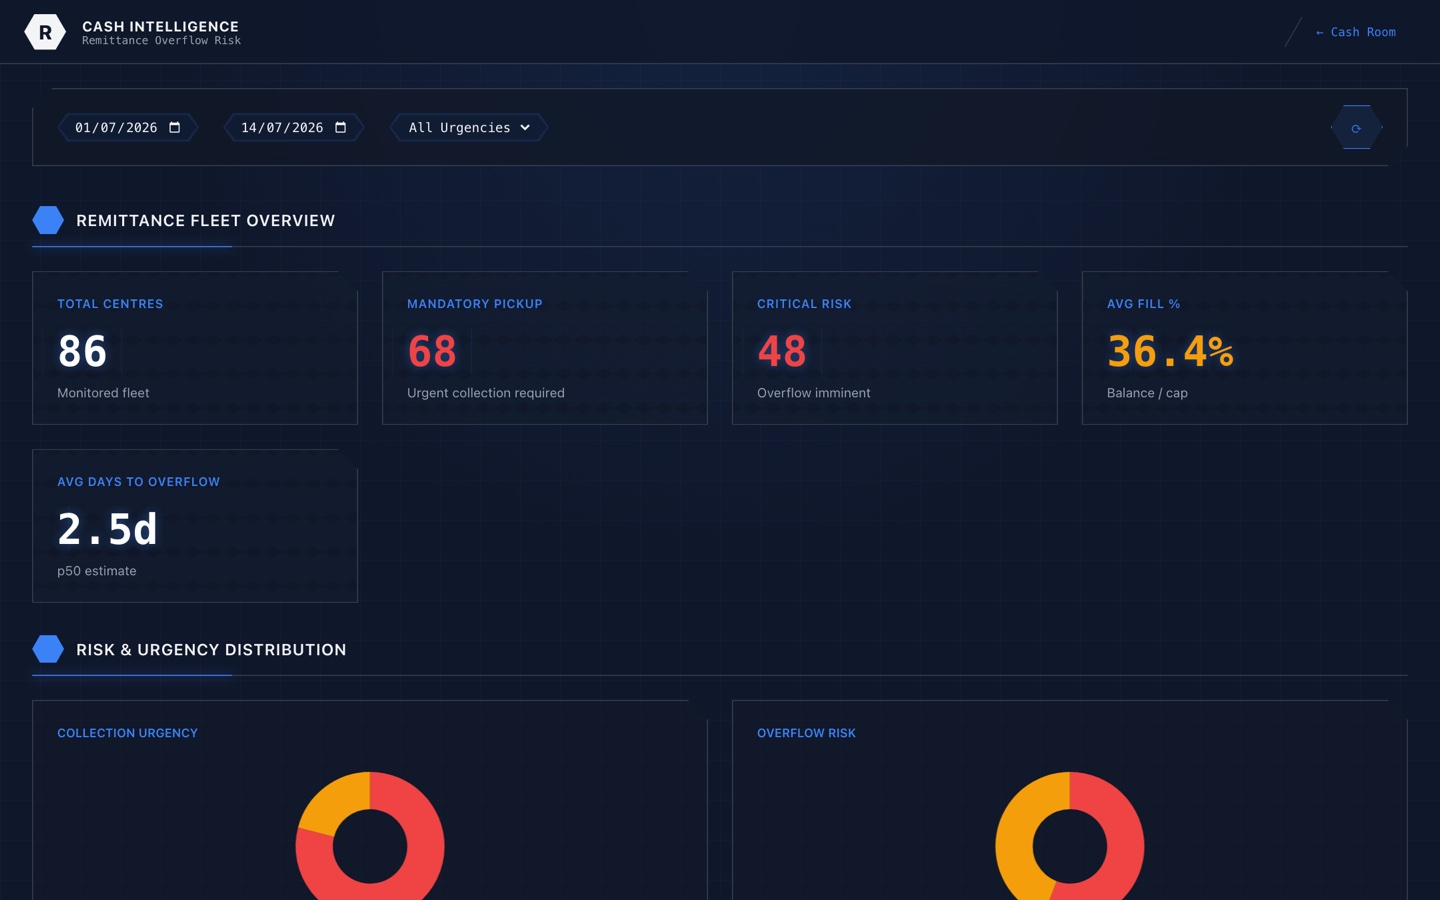
Remittance and overflow risk dashboard

Overflow before it overflows

Branches approaching their holding limits, ranked by urgency — so remittances get scheduled by risk, not by rota.

What cash actually costs

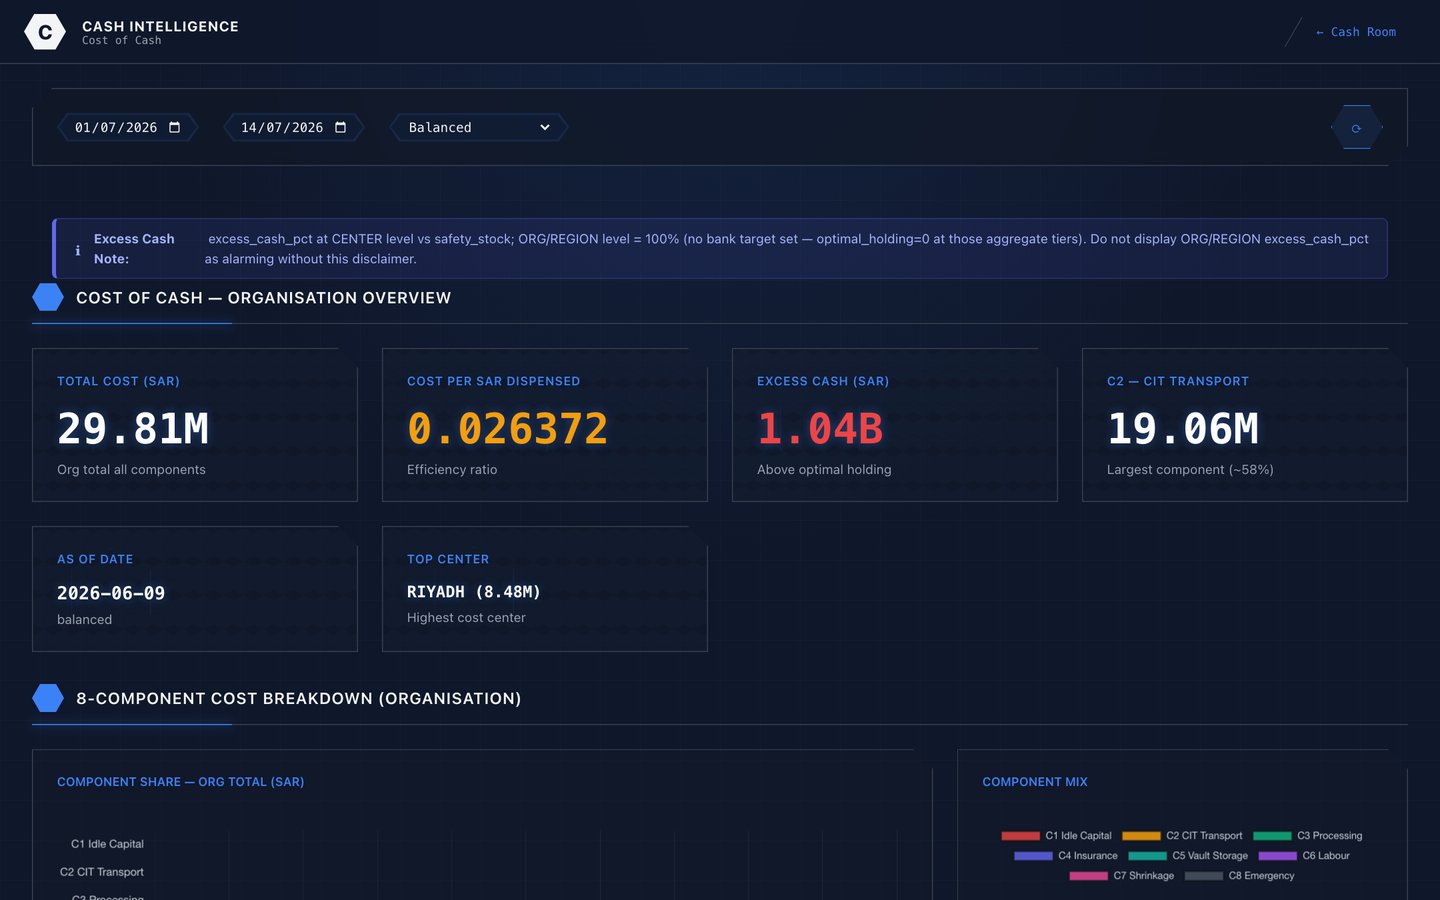
Idle cash earns nothing, CIT trips cost money whether they're needed or not, and nobody's budget line says "cash we didn't need to hold". Pricing the whole operation — carry, movement, insurance, effort — turns cash from a habit into a managed cost.

Cost of cash dashboard quantifying carry cost, CIT and idle balances

The bill, itemised

Carry cost, CIT, insurance and idle balances — what holding cash costs, per branch and for the network.

Cash centers and CIT performance dashboard

CIT, held to account

Cash centre throughput and CIT performance measured — evidence for the next contract negotiation.

What happens next

Yesterday's position is bookkeeping; tomorrow's is money. Demand forecasting per site — the same discipline AMI applies to ATMs — means replenishment is planned against predicted need, and deviations from forecast become the alarm, not the surprise.

Cash prediction dashboard with demand forecast

Demand, predicted

Forecast cash need per site with the drivers behind it — order tomorrow's cash on evidence, not instinct.

Cash risk and deviations dashboard

Deviations, ranked

Where reality is diverging from forecast, ordered by how much it matters — the day's worklist, generated.

The edges of the operation, covered

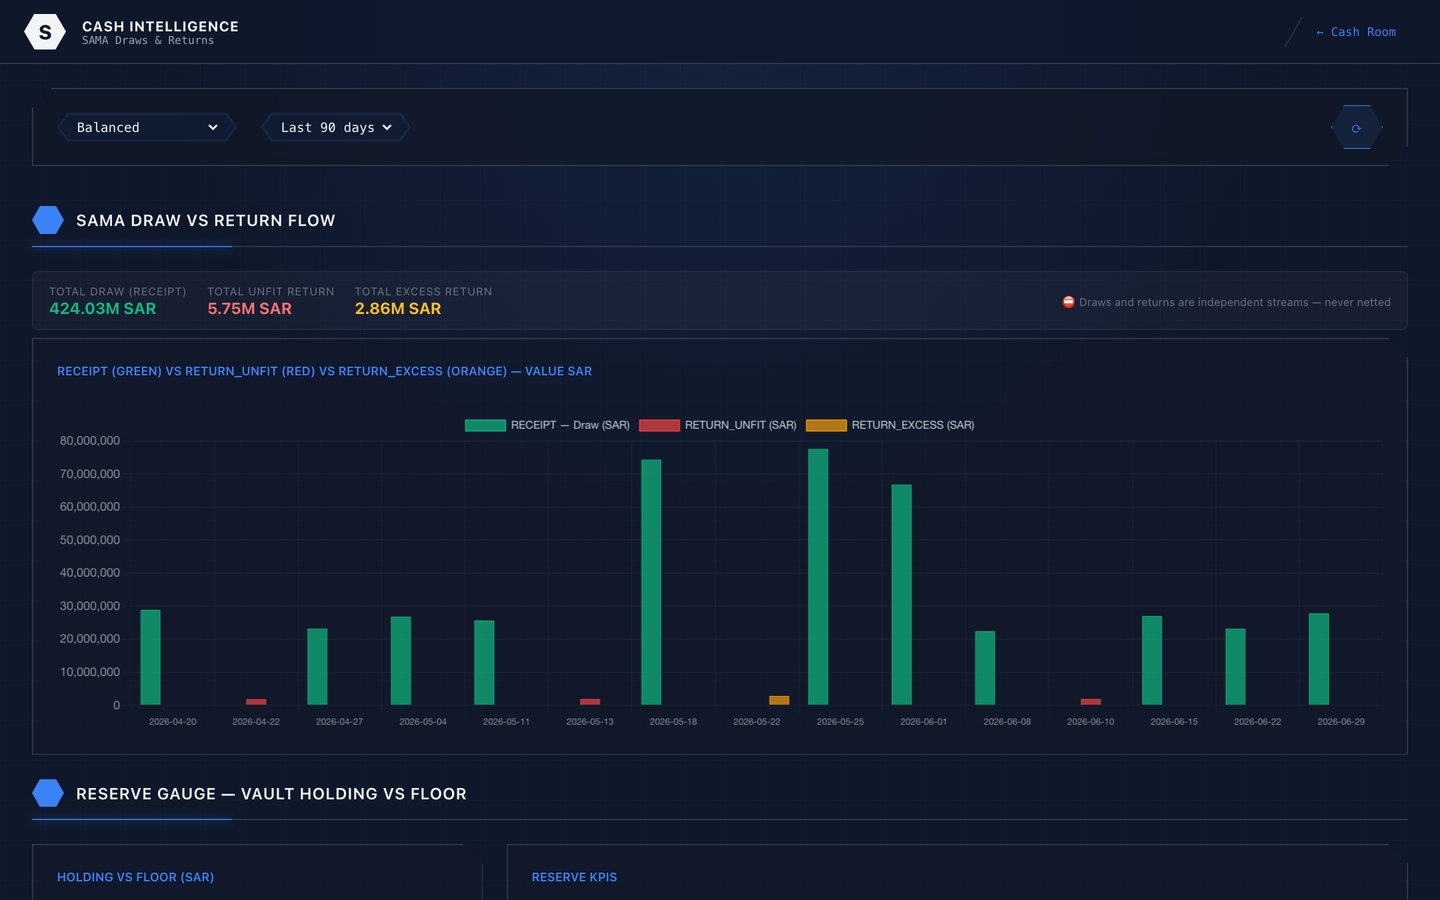
Cash doesn't stop at the branch door. On one side sits the central bank — draws, returns and the reporting that must reconcile. On the other sit corporate clients who deposit and draw cash as a service. Both edges live on the same spine as the branches.

Central bank draws and returns reconciliation dashboard

The regulator, reconciled

Draws and returns against the central bank tracked continuously — the report agrees with the operation because it comes from it.

Corporate cash services dashboard

Corporate cash, as a product

Corporate clients' deposits and draws measured like a business line — volumes, service levels and value per client.

See it against your own cash operation

These screens run on real operational data. The fastest way to judge the fit is to see the same dashboards built on a sample of yours.

Live Demo Book a Meeting See the Whole Platform