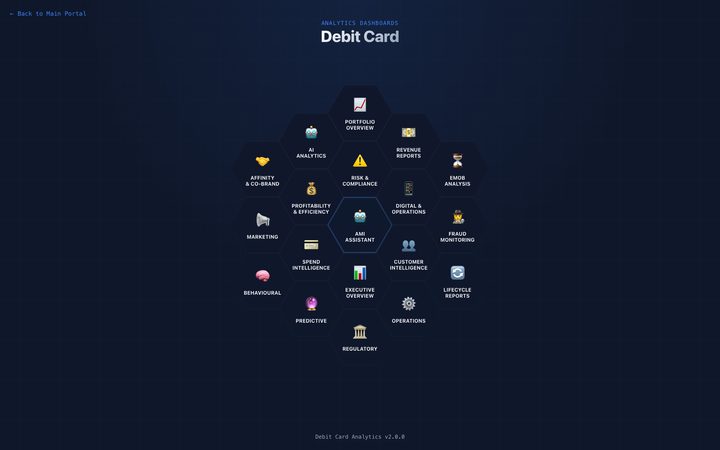
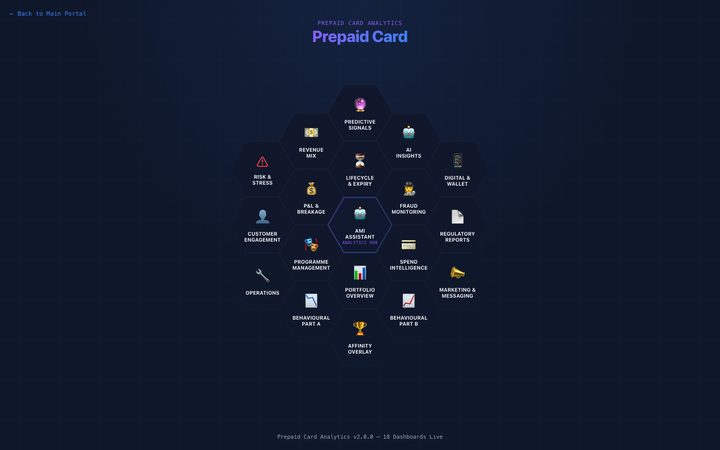
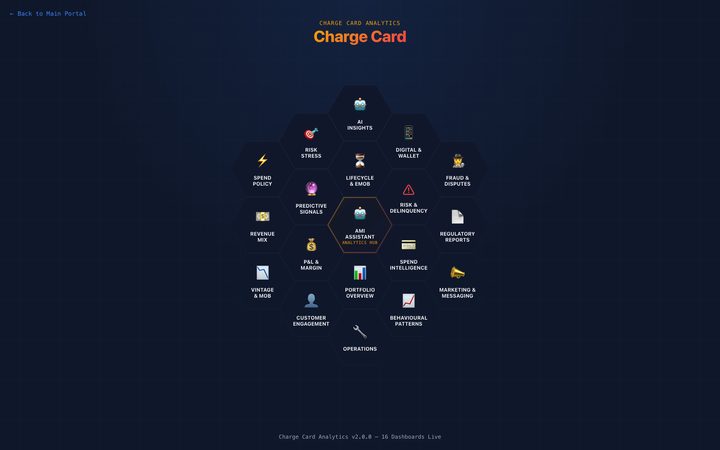
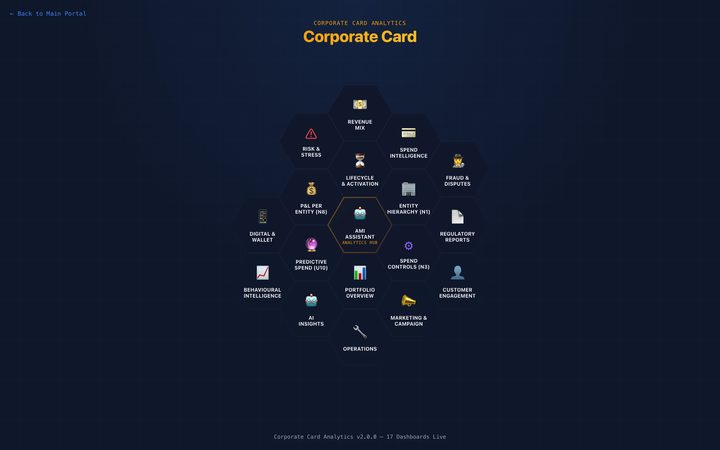
Most card reporting is five disconnected tools that answer different questions badly. AMI runs credit, debit, prepaid, charge and corporate through the same analytical model — so portfolio, risk, behaviour and growth mean the same thing on every product, and roll up cleanly.
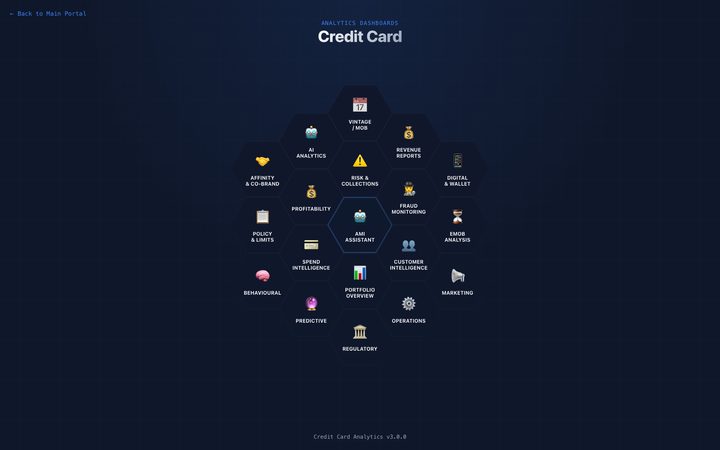
Each product gets its own full analytics suite — not a filter on a generic card report. Twelve lenses (portfolio, revenue, risk, fraud, customer, spend, marketing, digital, predictive, operations, regulatory and more) exist on all five, plus the analysis each product uniquely needs.


Balances and volumes are the easy part. The hard part is profit — decomposed to interchange, fees, interest and cost, per product and per segment, so pricing and limit decisions have evidence behind them.

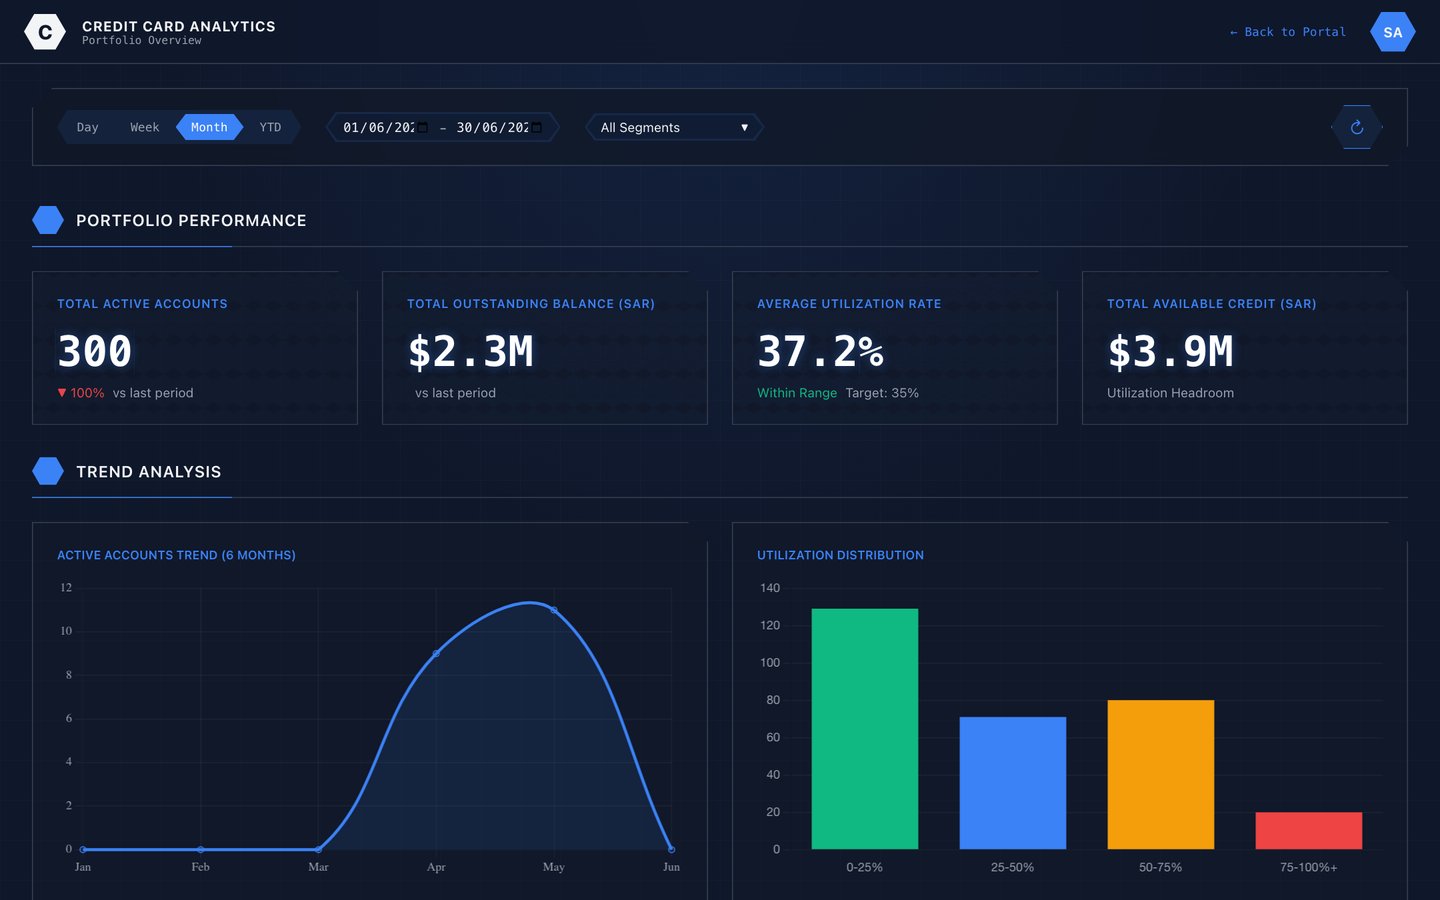
Accounts, balances, utilisation and trend — the portfolio position without waiting on a month-end pack.

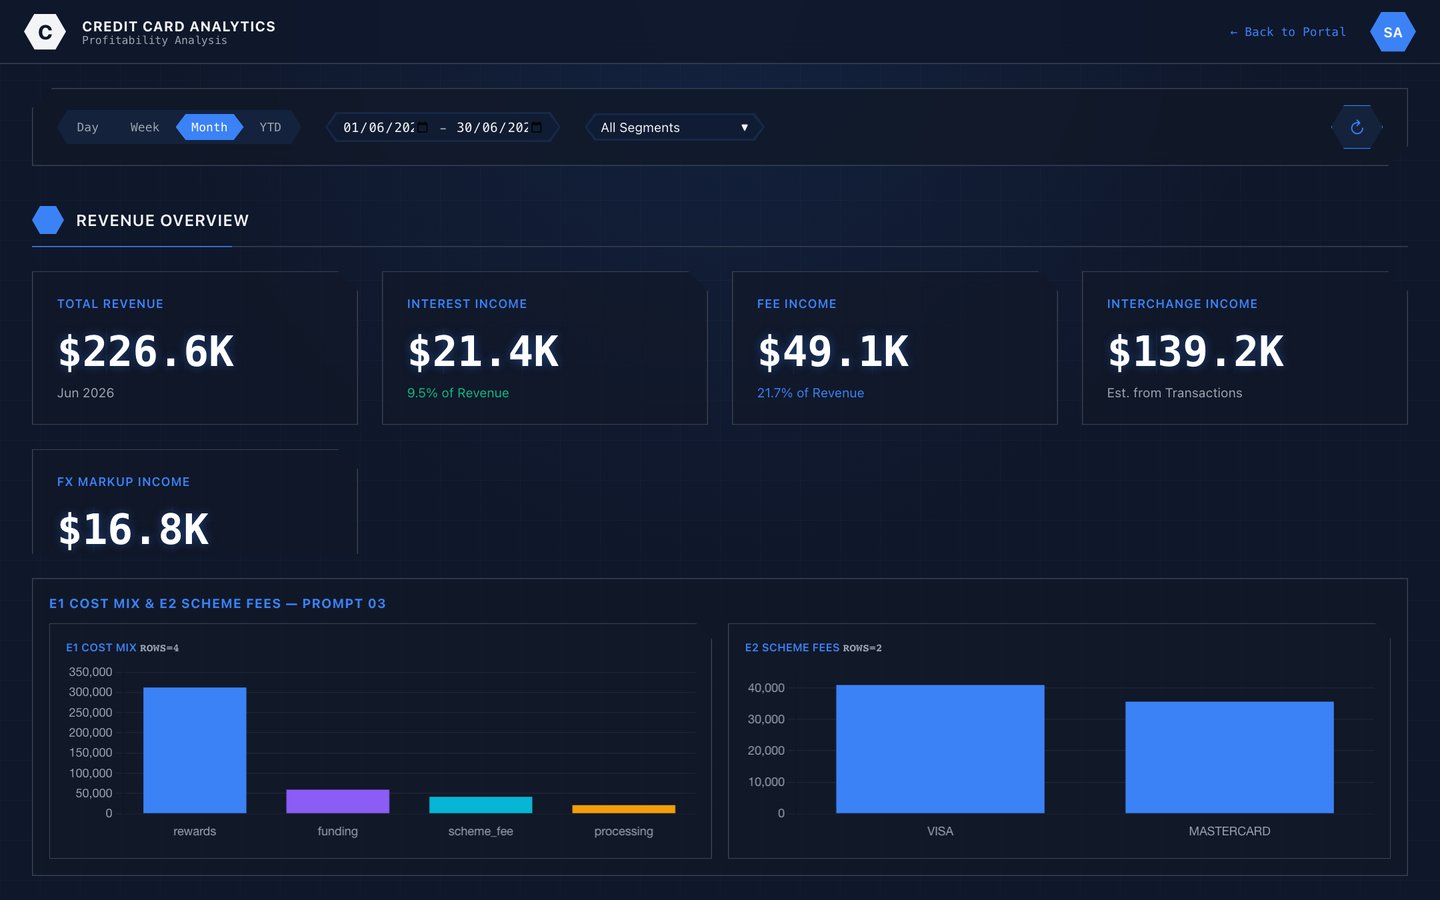
Interchange, fees, interest and cost per card and per segment — find the segments quietly losing money.

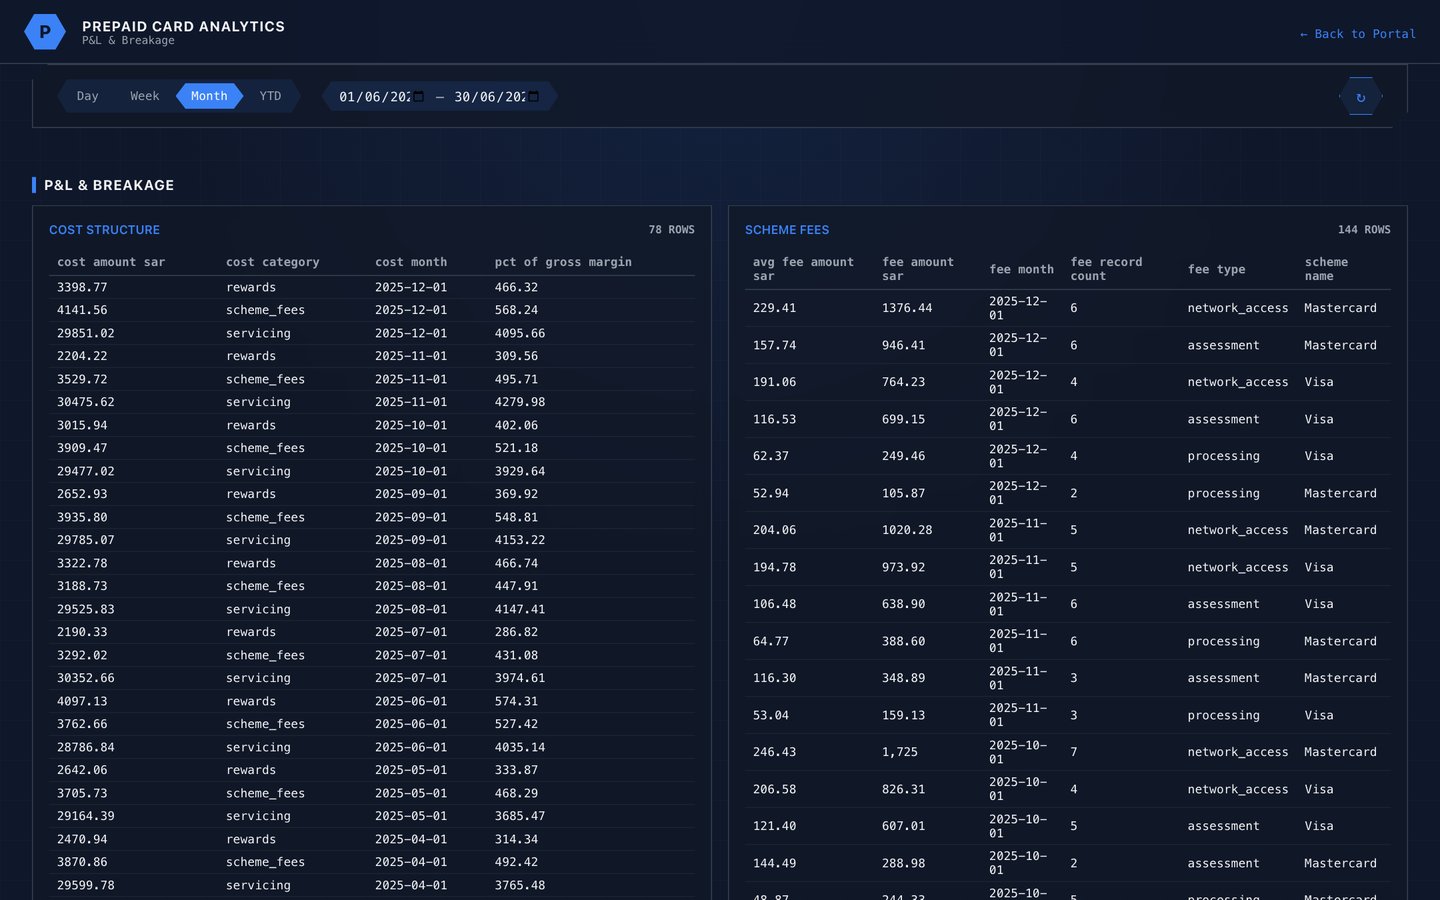
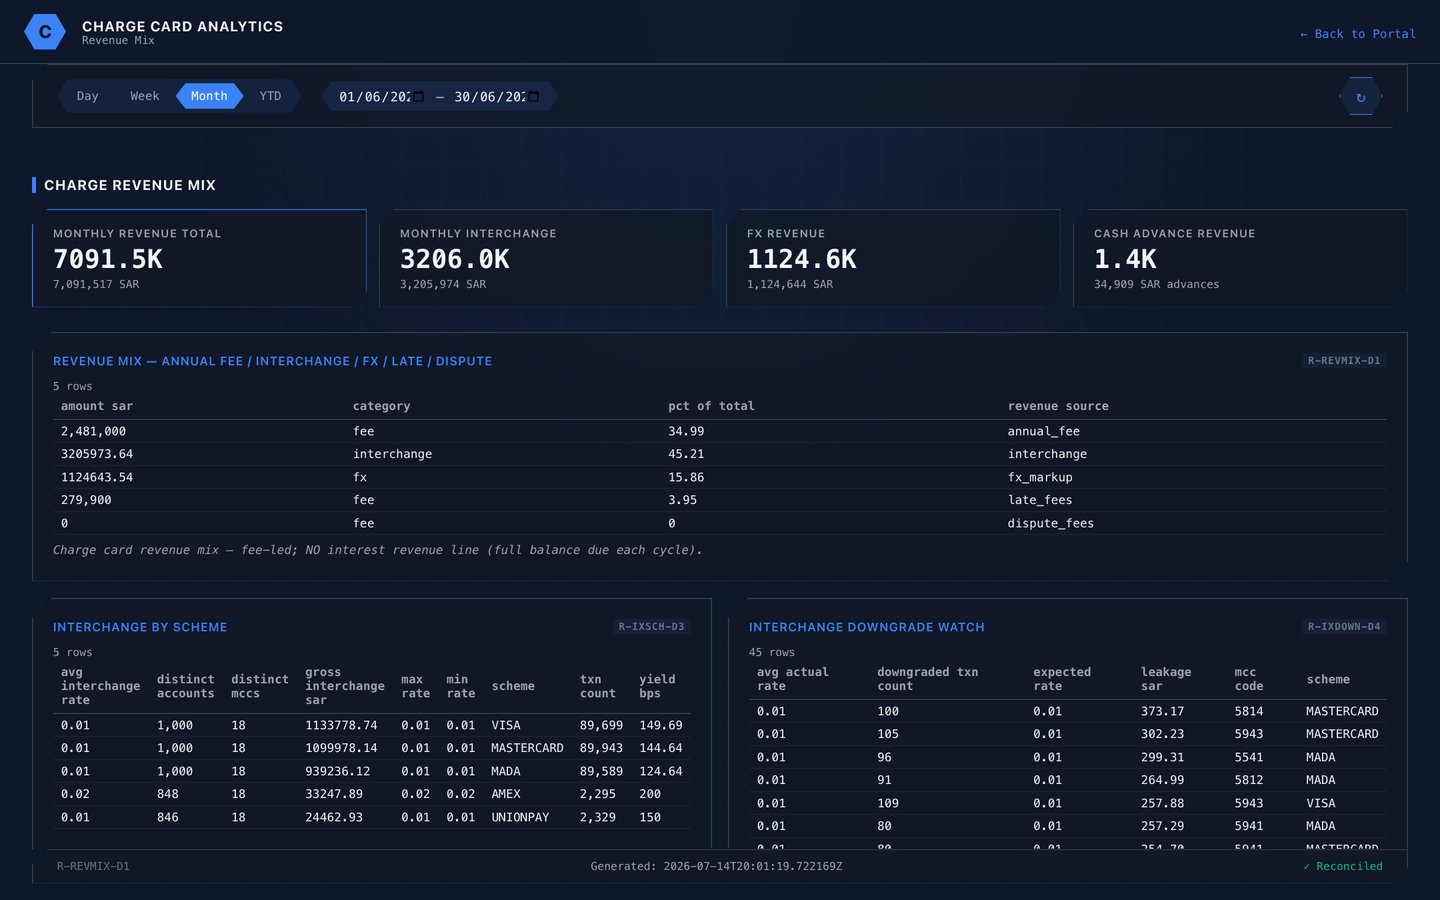
Prepaid and charge get a genuine P&L — not an afterthought bolted onto a credit-shaped report.

Every revenue line traced to its source, so you can see which streams are growing and which are eroding.
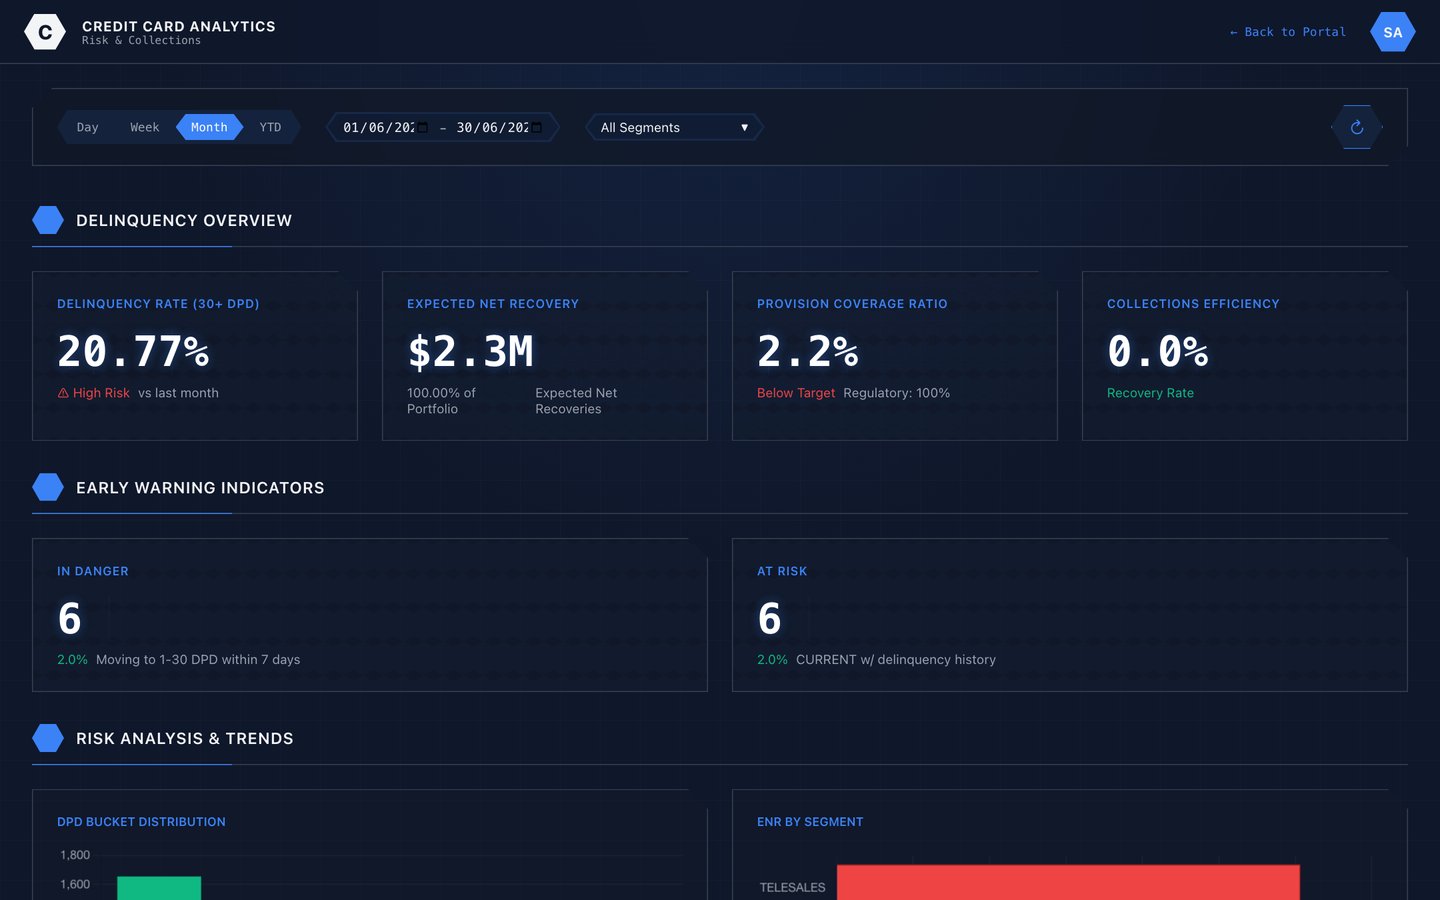
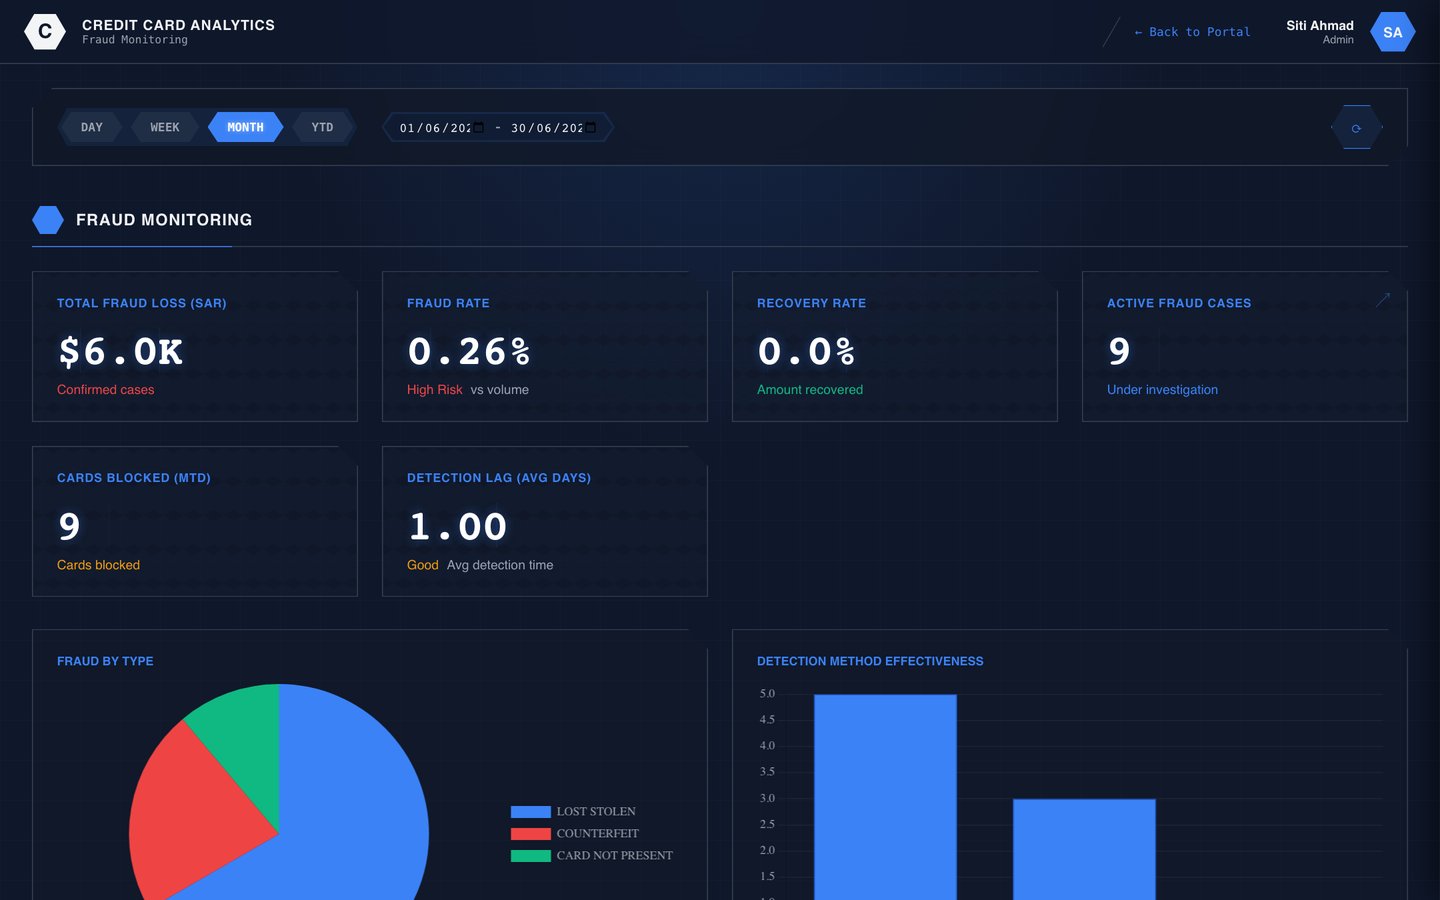
Delinquency, provisioning, fraud and controls on one spine — so risk on a corporate programme and risk on a debit book are measured the same way, and consolidate without a spreadsheet in the middle.

Buckets, roll rates and provisioning tracked continuously — act while an account is still recoverable.

Fraud and recovery rates by channel and type — where losses concentrate, and whether controls are working.

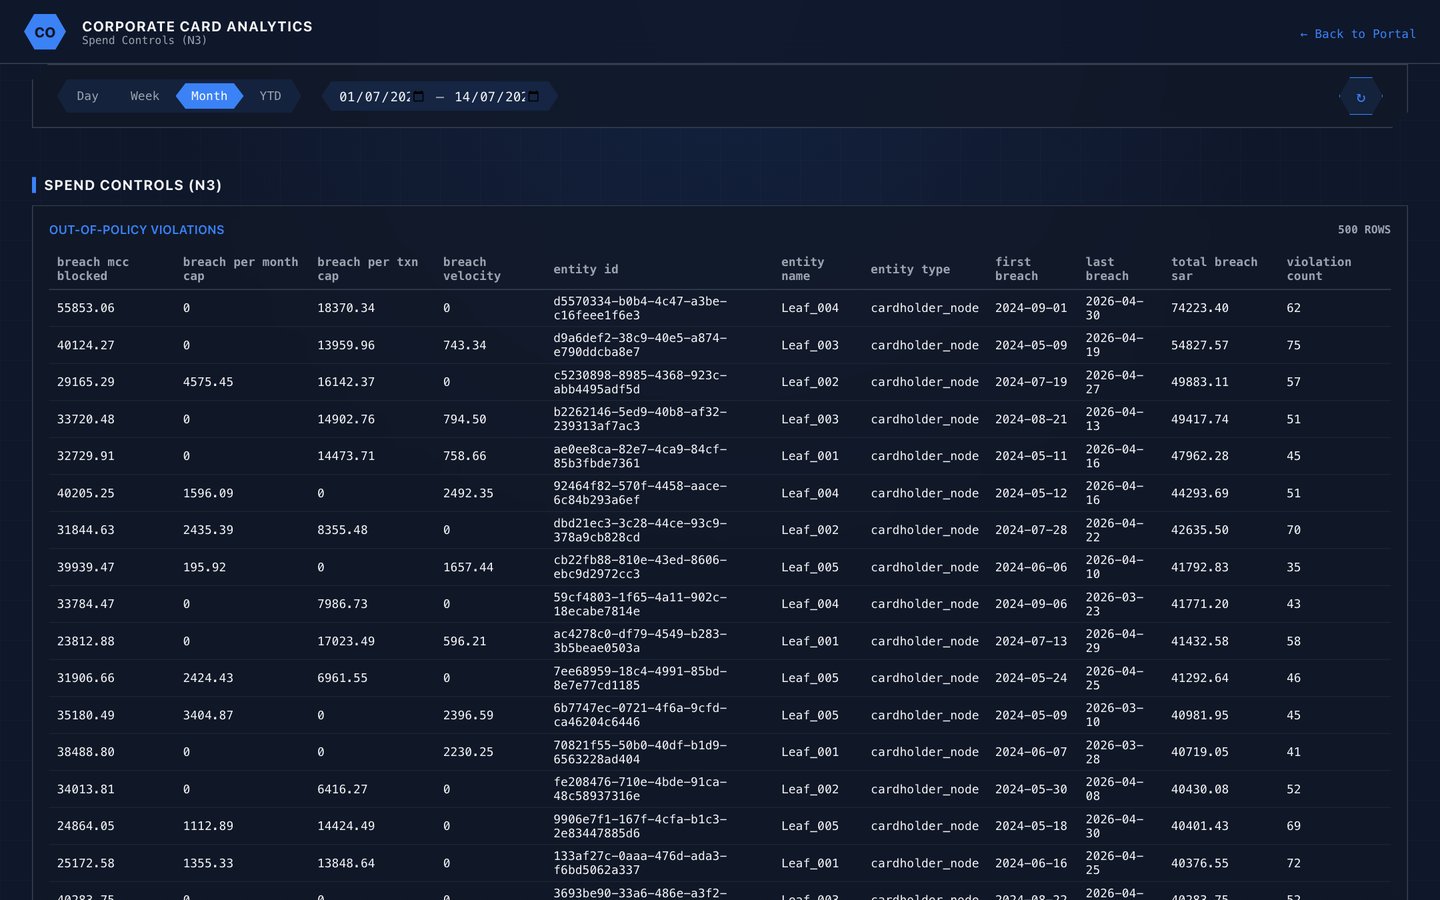
Spend limits, merchant controls and policy breaches per company — the governance corporate clients ask for in an RFP.

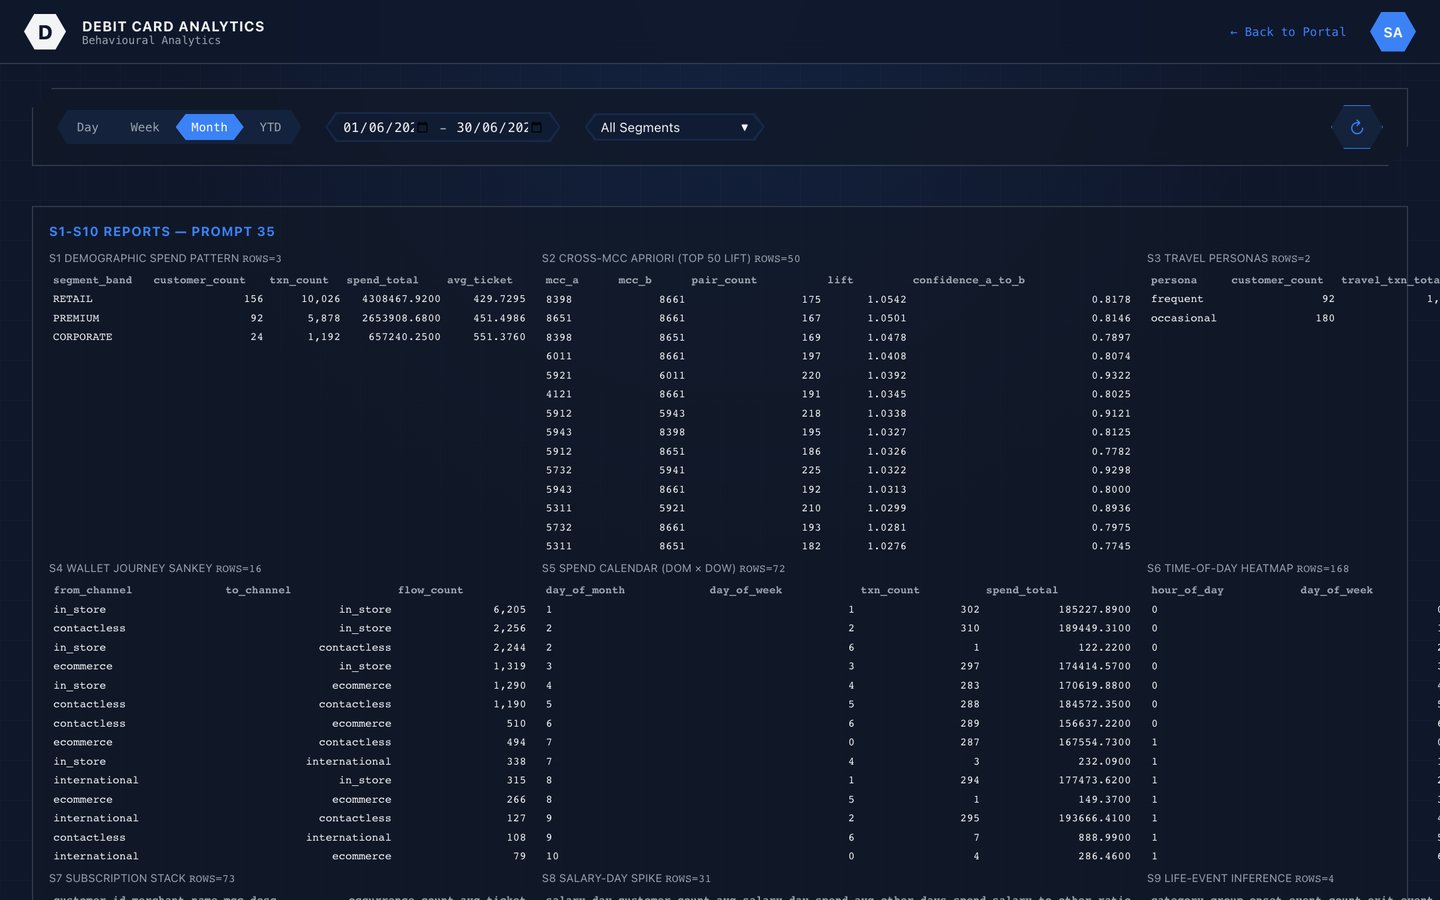
Debit risk measured on the same model as credit — so portfolio-level risk is a number, not a reconciliation exercise.
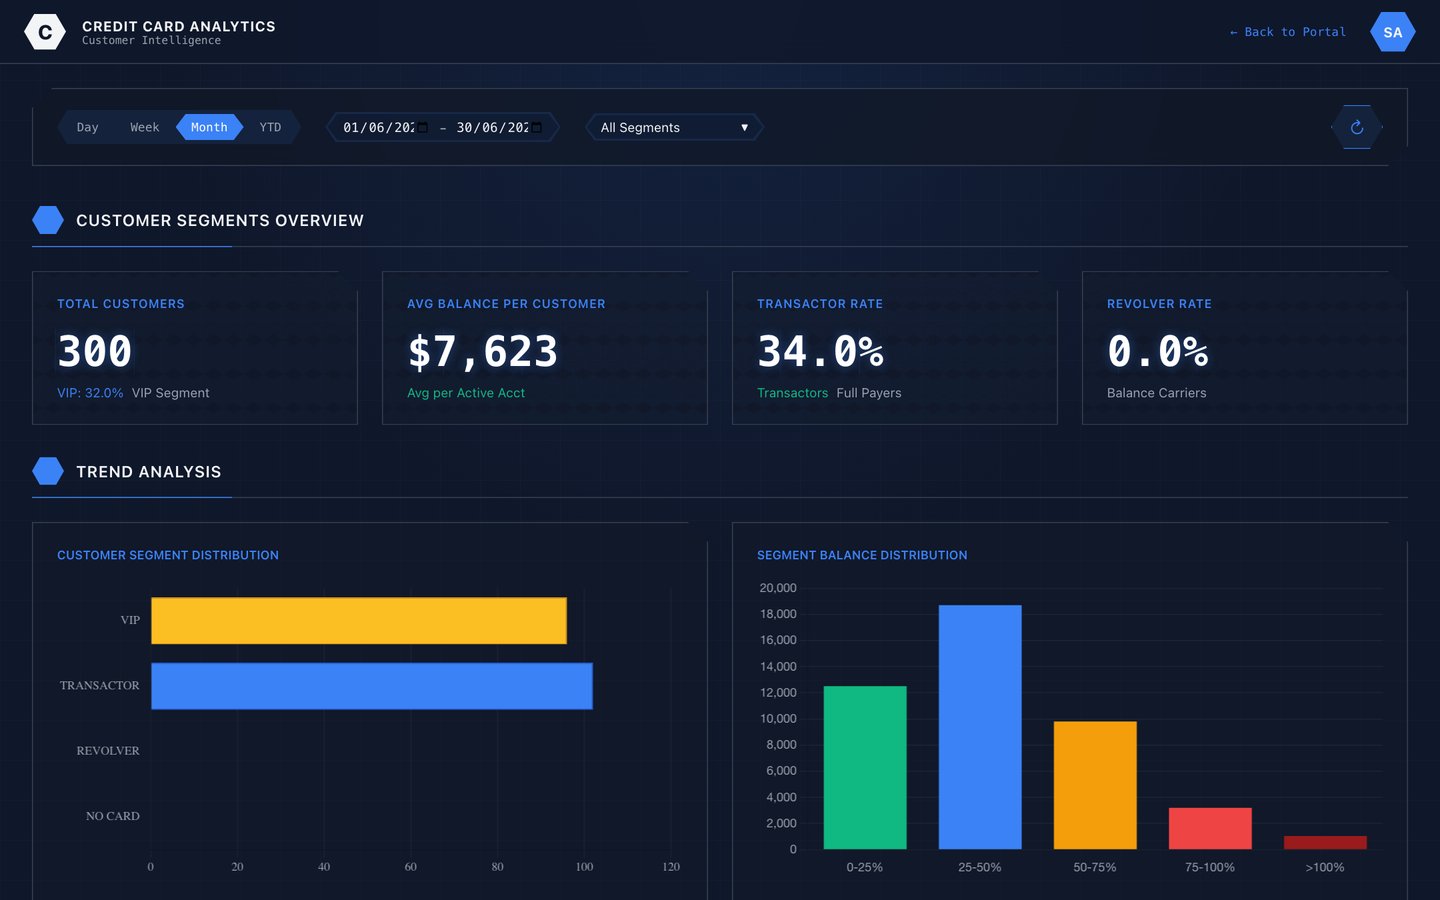
Behind every balance is a person with a pattern. Segmentation, affinity and vintage analysis show who your cardholders actually are — and which cohorts are worth acquiring more of.

Cardholders grouped by real behaviour and value — not by the product code they happened to sign up for.

How cards actually get used — revolvers versus transactors, dormancy risk, and the shifts that precede attrition.

Merchant affinity and co-brand performance — evidence for which partnerships earn their economics.

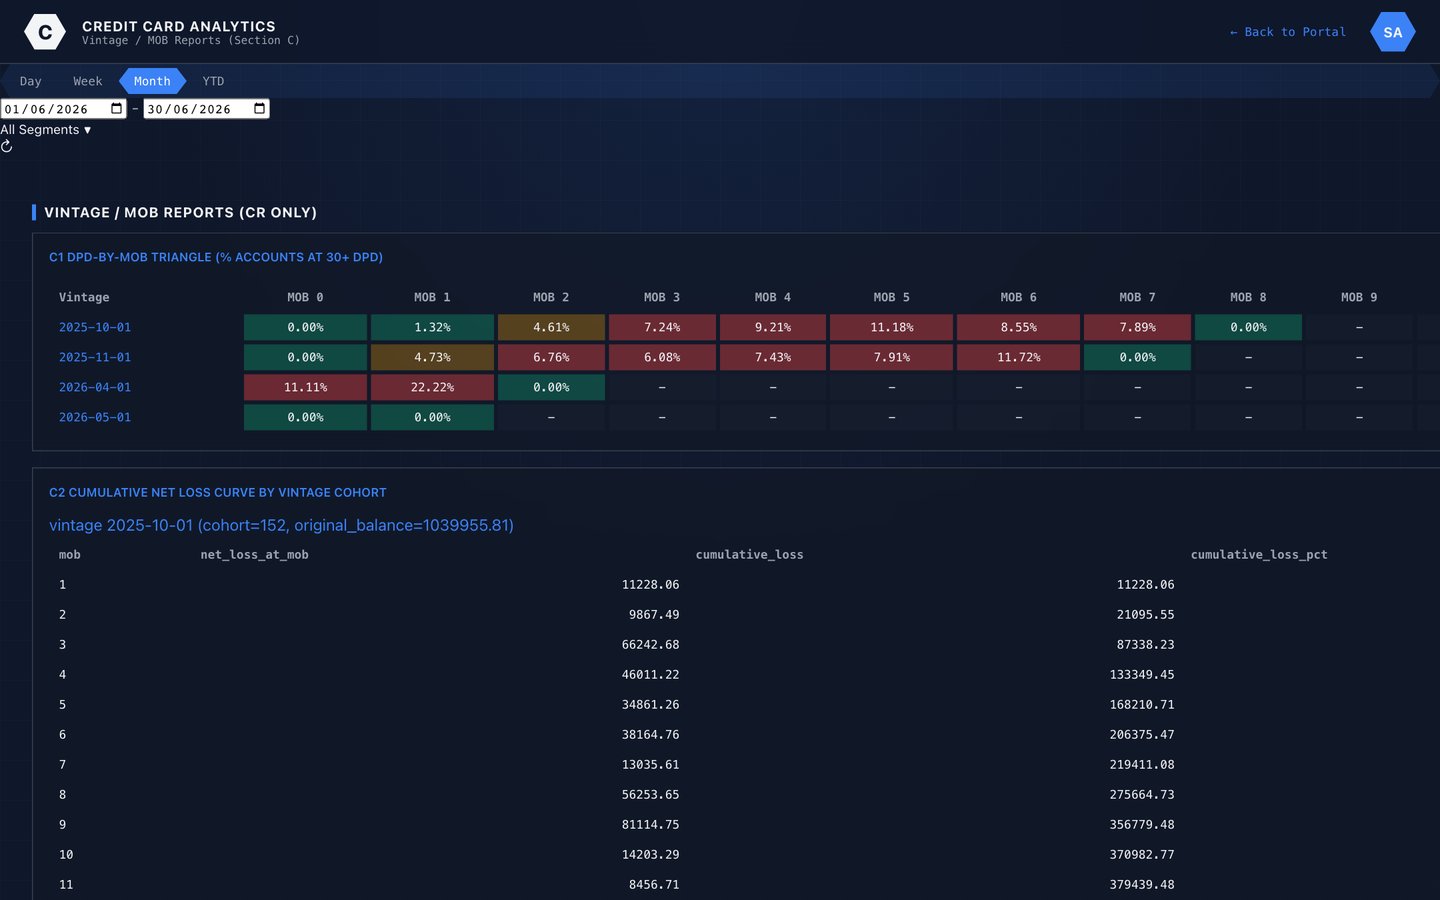
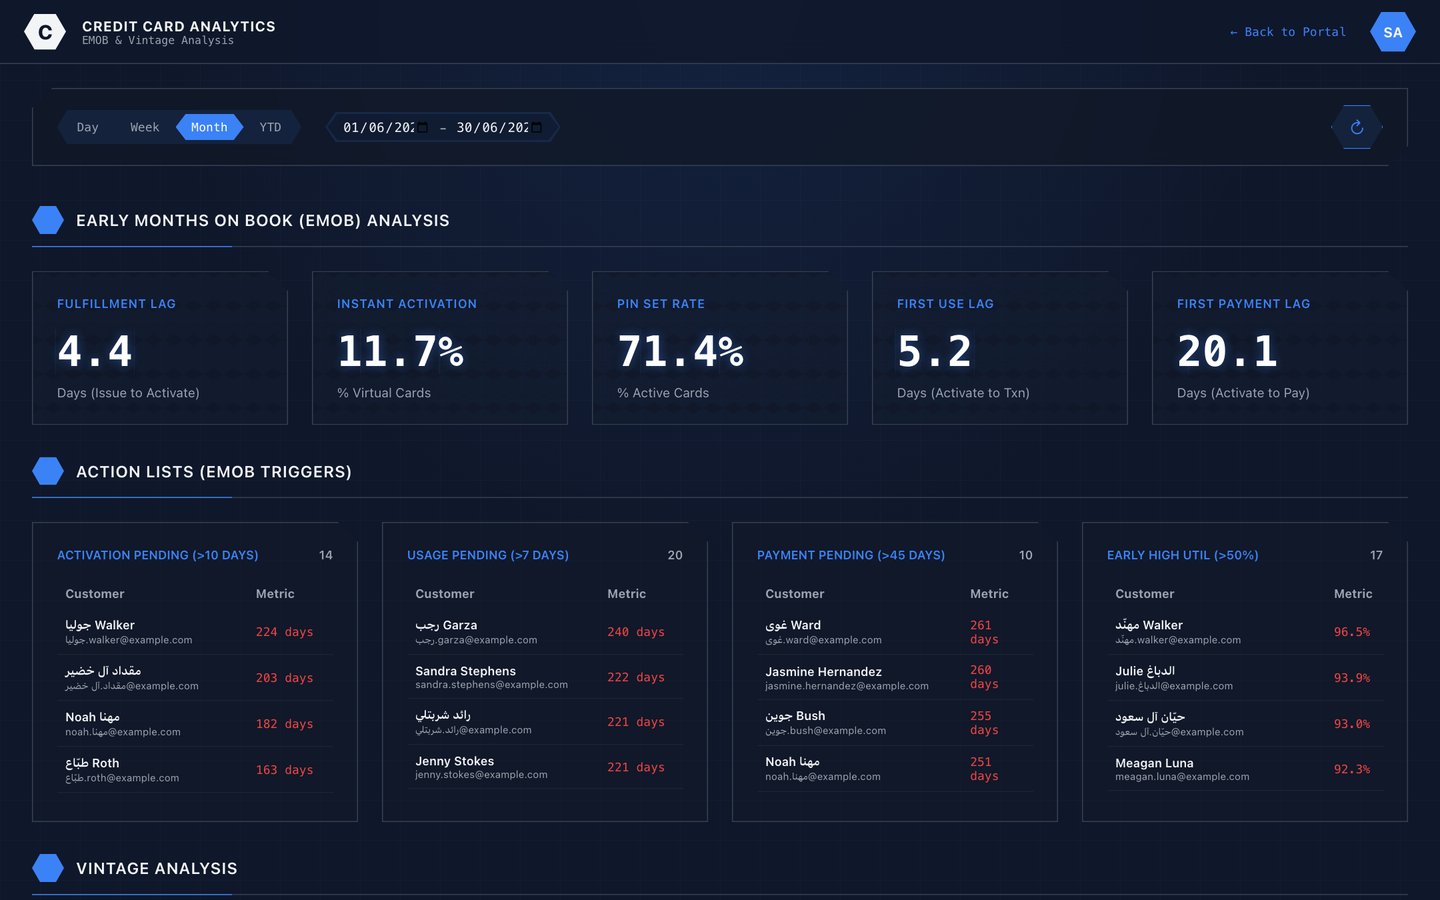
Vintage and months-on-book curves — whether this year's acquisitions are performing better than last year's.
Spend, campaigns and digital adoption measured against what they returned — so marketing spend is defensible and channel shift is visible while you can still act on it.

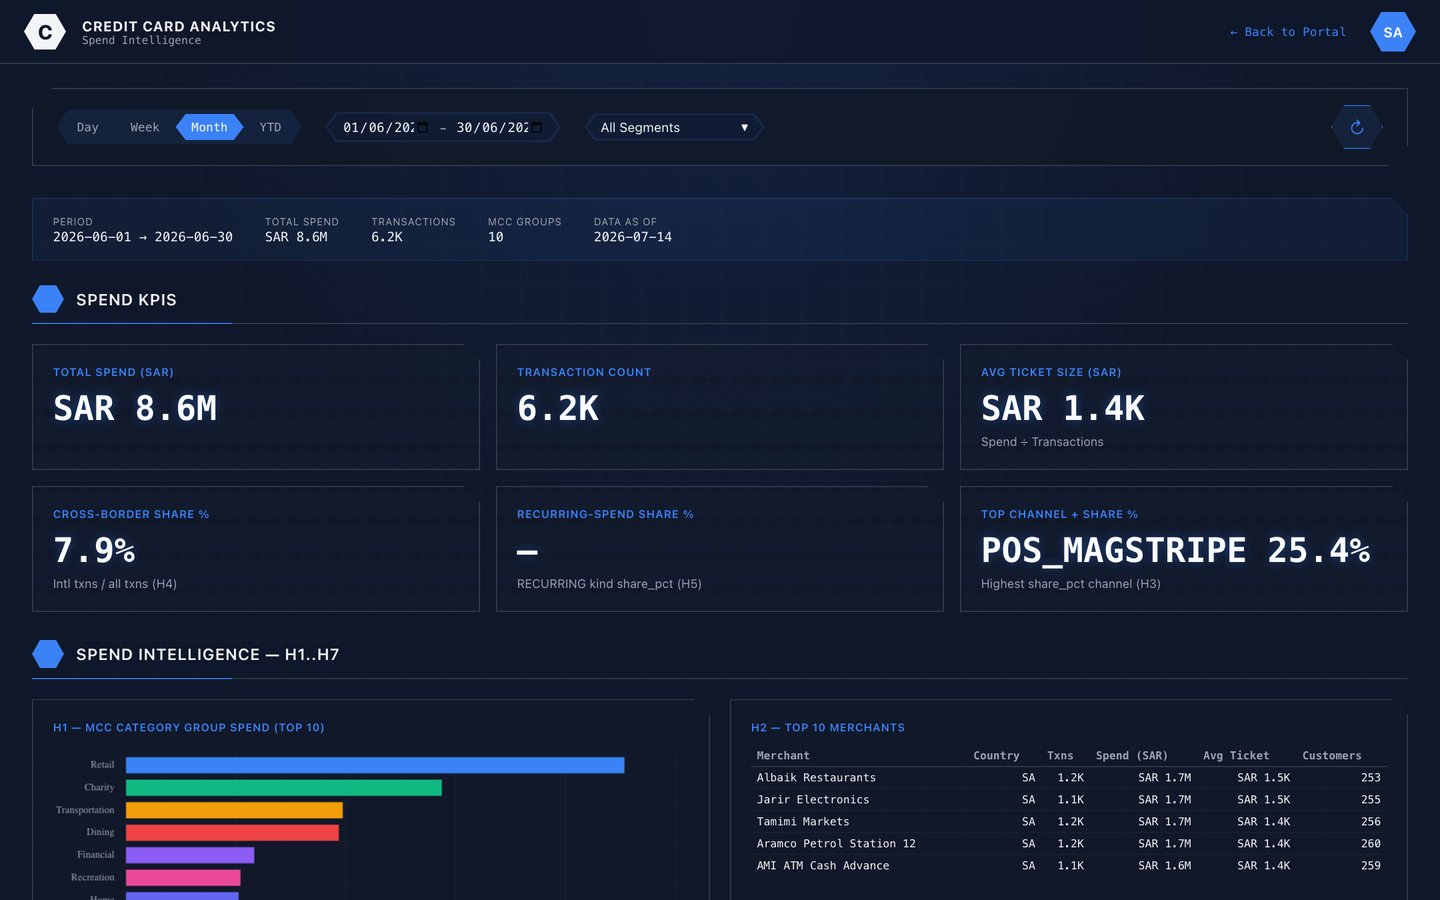
Spend by category, channel and entry mode — where volume lives and where it's quietly moving.

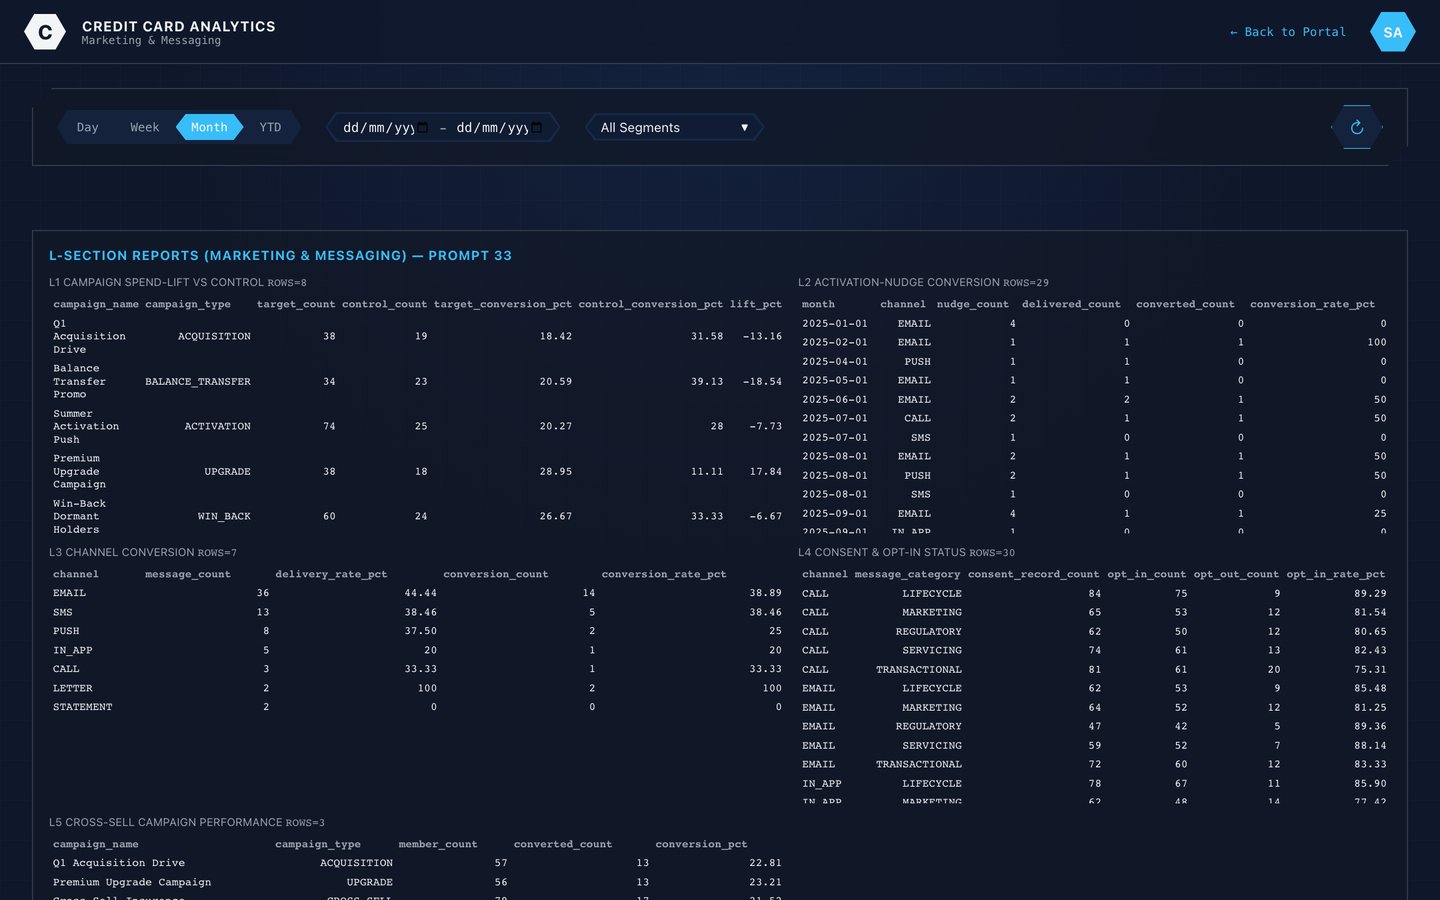
What each campaign cost and what it actually returned — so the next budget conversation has numbers in it.

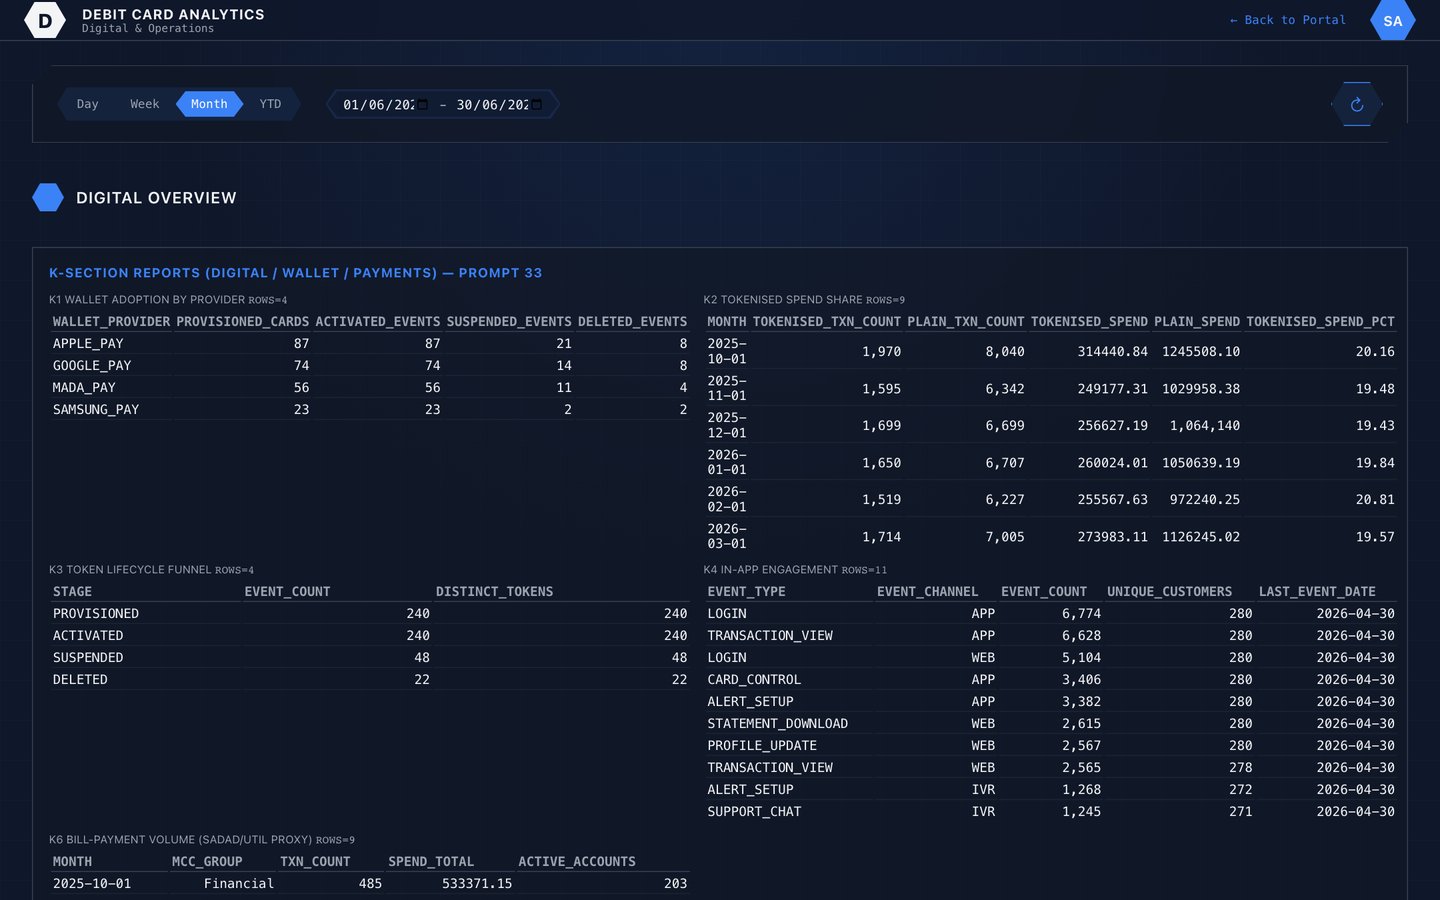
Tokenisation and wallet provisioning tracked per product — see the channel shift as it happens.

New spend categories surfaced as they emerge — the proposition opportunity before competitors price it.
The dashboards answer what happened. The models answer what's coming, and the assistant answers whatever you type — in English, against your own data, with its sources cited.

Who's about to leave, who's ready for more limit, and where balances are heading — scored, not guessed.

No SQL, no IT ticket, no three-week queue. Ask the question, get an explained answer that cites its sources.

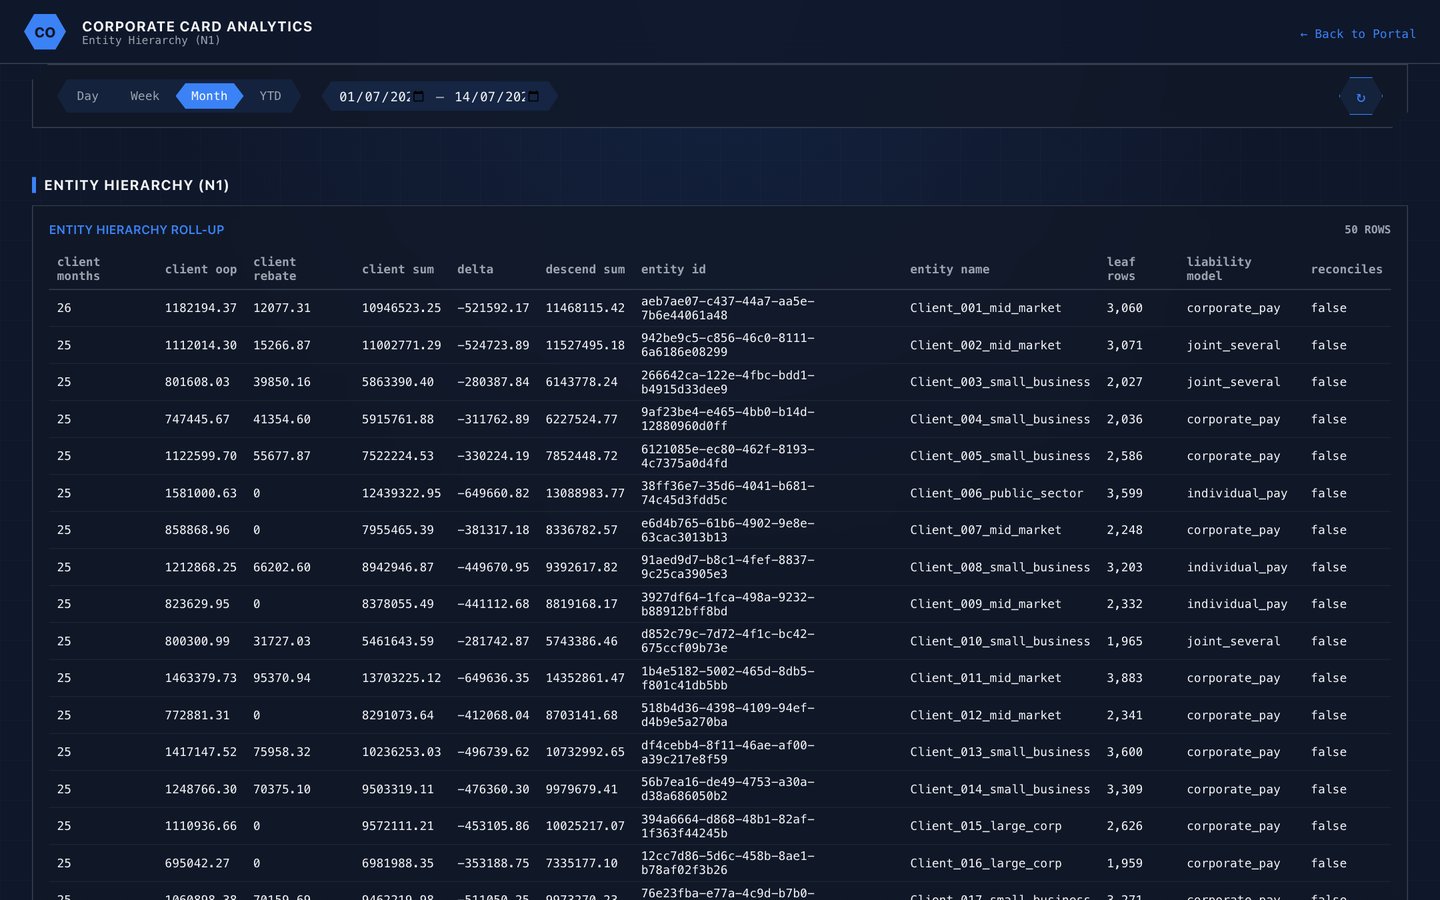
Company → department → cardholder hierarchies that roll up properly — the view a corporate client expects to see.

The whole portfolio distilled to what an executive needs — built from the same numbers, so it never contradicts the detail.
These screens run on real card data. The fastest way to judge the fit is to see the same dashboards built on a sample of yours.